


Authors:
Razvodovsky YE*
Grodno State Medical University, 80 Gorky Street, Grodno 230009, Belarus
Received: 17 October, 2014; Accepted: 16 March, 2015; Published: 18 March, 2015
Razvodovsky YE, Grodno State Medical University, 80 Gorky Street, Grodno 230009, Belarus, Tel: + 375 0152 70 18 84; Fax: +375 0152 43 53 41; Email:
Razvodovsky YE (2015) The Effects of Beverage Specific Alcohol Sale on Liver Cirrhosis Mortality in Russia. J Addict Med Ther Sci 1(2): 020-026. DOI: 10.17352/2455-3484.000006
© 2015 Razvodovsky YE. This is an open-access article distributed under the terms of the Creative Commons Attribution License, which permits unrestricted use, distribution, and reproduction in any medium, provided the original author and source are credited.
Liver cirrhosis mortality; Beverage-specific alcohol sale; ARIMA time series analysis; Russia; 1970-2005
Background: Liver cirrhosis is a major cause of deaths in many developed countries. There is evidence that beverage preference may have modifying influence on liver cirrhosis risk independently of the amount of alcohol consumed.
The aim of this study was to examine the relation between the consumption of different beverage types and liver cirrhosis mortality rates in Russia.
Method: Time-series analytical modeling techniques were used to examine the relation between the sale of different alcoholic beverages (vodka, wine, beer) and age-standardized male and female liver cirrhosis mortality data for the period 1970-2005.
Results: Total alcohol sale is a statistically significant associated with both male and female liver cirrhosis mortality rates, implying that a 1-litre increase in per capita alcohol sale is associated with an increase in male mortality of 17.2% and female mortality of 5.3%. The analysis also suggests that of the three beverages (vodka, beer and wine) vodka alone was associated with liver cirrhosis mortality in Russia. The estimated effects of vodka sales on the liver cirrhosis mortality rate are clearly statistically significant for both sexes: a 1 liter increase in vodka sale would result in a 37.6% increase in the male liver cirrhosis mortality rate and in 9.3% increase in female mortality rate.
Conclusions: The findings from present study support the substantial literature which demonstrates a close link between alcohol consumption and liver cirrhosis mortality at aggregate level, and most important, suggests that this relationship is mediated by beverage preference.
Introduction
Liver cirrhosis is a major cause of deaths in many developed countries [1]. Over the last three decades liver cirrhosis mortality rates have gradually declined in the European Union [1]. This overall decline, however, masks large differences in trends between member states. In the wine drinking countries of Southern Europe (France and Italy), a reduction in liver cirrhosis mortality rates is being observed, mainly related to the decline in overall alcohol consumption [2]. Conversely, liver cirrhosis mortality rates have increased across the spirits/beer binge drinking countries of Northern Europe and Britain [2]. An increase in liver cirrhosis mortality rates also appeared in Eastern Europe, particularly in the former Soviet republics [3]. The reasons for geographic differences in liver cirrhosis mortality rates are still poorly understood and most likely are because of differences in the risk factors, including alcohol consumption [2,3].
There is general consensus about causal role of alcohol for the risk of liver cirrhosis [4-7]. Liver cirrhosis mortality rate is a reliable indicator of the alcohol-related harm at the population level since there is a strong relationship between mortality rate and alcohol consumption per capita [8]. The outcome of the time series analysis showed a positive and statistically significant relationship between liver cirrhosis mortality and population drinking in 13 of 14 Western European countries for males and in 9 countries for females [9]. It appears that the effect of alcohol on liver cirrhosis mortality rate was stronger in the northern European spirits countries characterized by a binge drinking pattern, than in the southern European wine countries with a high average consumption, which is more evenly distributed throughout the week. A positive and statistically significant relationship between per capita alcohol consumption and liver cirrhosis mortality was found in eight of nine Eastern European countries [10]. Furthermore, estimates were stronger in spirits drinking Eastern European countries than in ‘non-spirits' countries.
Several individual level studies have reported that the consumption of particular beverages was related to liver cirrhosis morbidity and mortality. In a survey of over 30.000 persons in Denmark, drinking beer or spirits was more likely to be associated with liver cirrhosis disease than drinking wine [11]. Longnecer and coauthors [12] demonstrated that consumption of large amount of distilled spirits was associated with higher risk of liver cirrhosis mortality among white immigrant of first-generation residents of Pennsylvania. Some clinical studies have found that the type of alcohol consumed may influence the risk of developing liver disease. In particular, Bode and coauthors [13] reported a strong association between the risk of alcoholic liver disease and beer consumption in alcoholics. In another study, spirits (tequila) was the predominant beverage in the group of patients with alcoholic liver disease [14].
A number of studies have examined beverage specific alcohol consumption and liver cirrhosis mortality at the aggregate level. In his pioneering work Schmidt and Broneto [15] using cross-sectional analysis of US states data reported that wine had the strongest association with liver cirrhosis mortality. Terris [16] in his analysis of time series from the US, Canada, and the UK highlighted that per capita wine and spirits consumption contribute to trends in mortality from liver cirrhosis. Gruenevald and Ponicki [17] using cross-sectional time-series analysis based on data from 50 states in the United States found a beverage specific effect of distilled spirits sales on liver cirrhosis mortality rates: 1% increases in spirits sales were reflected in 0.282% increases in cirrhosis mortality rates. At the same time, there were no significant effects for either beer or wine sales. Similarly, Roizen and coauthors [18] reported that liver cirrhosis mortality is more strongly associated with consumption of spirits than with other alcoholic beverages in the US from 1949 and 1994, when it was primarily a beer-drinking country. Kerr and coauthors [19] replicates this finding in his cross-sectional time series analysis based on data from five predominantly beer-drinking English-speaking countries and identified spirits to be largely responsible for the association between alcohol and liver cirrhosis mortality rates. A time series analysis based on Belarusian data also indicated that liver cirrhosis mortality have a close link to spirits consumption than to wine/beer and total alcohol consumption [20]. In a recent analysis of time series from Australia between 1935 and 2006 spirits consumption was found to be the main driving factor in liver disease mortality rate between 1935 and 1975, while beer consumption was found to be the most significant predictor in the last three decades [21]. The disparities of beverage specific effects on liver cirrhosis mortality rates in previous studies are likely due to considerable variation in drinking patterns and other risk factors over time and regions.
Russia ranks among the world's heaviest drinking countries with an annual official consumption rate about 10 litres of pure alcohol per capita, while independent estimates show a figure as high as 17 litres [22,23]. The distinctive trait of Russian drinking culture is a high overall level of alcohol consumption and the heavy episodic (binge) drinking pattern of strong spirits (vodka), leading to an increase in deaths from alcohol poisoning and cardiovascular diseases [24-26]. In line with these pieces of evidence, we assume that occasional heavy drinking of vodka in Russia should result in a positive association between vodka sale and liver cirrhosis mortality at the aggregate level. In this study we will test the hypothesis of beverage-specific effect on liver cirrhosis mortality by analyzing Russian's time series data between 1970 and 2005.
Methods
Data
The data on age-adjusted sex-specific liver cirrhosis mortality rates per 1000.000 of the population are taken from the Russian State Statistical Committee (Rosstat). The Rosstat's cause of death classification has undergone several changes in recent decades. Until 1988 the cause of death classification was based upon the Soviet nomenclature which had a limited number of causes of death in comparison with the International Classification of Diseases (ICD) system. From 1989-1998 Rosstat used a coding scheme that was based on ICD-9. From 1999 a new coding system based on ICD-10 was introduced. Rosstat issued a table of correspondence between its classification system and ICD-9 and ICD-10 and it has been claimed that the Russian system of coding is compatible with ICD-9 codes 571.0 and with ICD-10 codes K 70.2. While alcoholic liver cirrhosis mortality is often greatly underreported [27], the total liver cirrhosis mortality category, not simply the sub-category “alcoholic liver cirrhosis” has been used. This approach reflects prevailing reservations about the validity of subgroup discriminations in the coding of cirrhosis mortality. The data on per capita beverage-specific alcohol sales (vodka, wine, beer in liters of pure alcohol) as a proxy for total alcohol consumption were taken from Rosstat's annual reports (www.gks.ru).
Statistical analysis
To examine the relation between changes in the consumption of different types of alcoholic beverage and liver cirrhosis mortality across the study period a time-series analysis was performed using the statistical package “Statistica”. The dependent variable was the annual liver cirrhosis mortality and the independent variables were aggregate beverage-specific alcohol sales. Bivariate correlations between the raw data from two time-series can often be spurious due to common sources in the trends and due to autocorrelation [28]. One way to reduce the risk of obtaining a spurious relation between two variables that have common trends is to remove these trends by means of a ‘differencing' procedure, as expressed in formula:
xt = xt - xt-1
This means that the annual changes ‘∇' in variable ‘X' are analyzed rather than raw data. The process whereby systematic variation within a time series is eliminated before the examination of potential causal relationships is referred to as ‘prewhitening'. This is subsequently followed by an inspection of the cross-correlation function in order to estimate the association between the two prewhitened time series. It was Box and Jenkins [29] who first proposed this particular method for undertaking a time series analysis and it is commonly referred to as ARIMA (autoregressive integrated moving average) modeling. This method provides a more sophisticated statistical approach to the evaluation of trend data. We used ARIMA modeling to estimate the relationship between the time series liver cirrhosis mortality and alcohol consumption rates in this paper. In line with previous aggregate studies [30-32], we estimated semi-logarithmic models with logged output. The following model was estimated:
where ∇ means that the series is differenced, M is liver cirrhosis mortality rates, a indicates the possible trend in mortality due to other factors than those included in the model, A is the beverage-specific alcohol sales, β is the estimated regression parameter, and N is the noise term. The percentage increase in liver cirrhosis mortality rates associated with a 1-litre increase in alcohol sales is given by the expression: (exp(β1)-1)*100.
A change in aggregate level drinking is expected to have an immediate effect on acute forms of alcohol-related problems (such as accidents and injuries), as well as a long-term effect on chronic problems (liver cirrhosis) [30]. As liver cirrhosis attributed to the chronic rather than acute alcohol-related problems we should expect that the mortality response to changes in aggregate level alcohol consumption will be distributed over several years [30]. Thus, we should consider the time-lag problem. In order to deal with this problem we inspected the cross-correlations between two time series at different lags.
Results
The average per capita alcohol sales figure was 8.2 liters with vodka being the drink overwhelmingly consumed. However, these mean figures mask differing trends among the beverages across the period (Figure 1). While there has been a slight drop in vodka sales from 4.84 liters in 1970 to 3.88 liters in 2005 and wine sales have remained at roughly the same level there has been a sharp growth in beer sales – especially in recent years. Between 1998 and 2005 the per capita sales figure for beer rose from 1.16 to 3.08 liters. It is also worth noting that beverage sales have experienced sharp fluctuations across the period. Thus, a brief Andropov's anti-alcohol campaign in the early 1980s resulted in a decline in vodka sales. An especially sharp fall was recorded in vodka and wine sales in 1985-1987 that coincided with Mikhail Gorbachev's anti-alcohol campaign. Similarly, the collapse of the Soviet Union and the ending of the state's alcohol monopoly in the early 1990s were accompanied by a sharp rise in vodka sales.
According to official statistics, the male liver cirrhosis mortality rate increased 3.5 times (from 134.9 to 469.5 per 1 000.000 of population) and female mortality rate increased 3.9 times (from 65.4 to 255.2 per 1 000.000 of population) in Russia from 1970 to 2005. Across the whole period the male liver cirrhosis mortality rate was 2.2 times higher than the female rate (214.8 vs. 98.9 per 1 000.000) with a rate ratio of 2.1 in 1970 decreasing to 1.8 by the 2005 (Table 1). For both sexes the time series liver cirrhosis mortality rates fluctuate greatly over the period: decreased markedly between 1984-1988 (by 31.8% and 19.8% for men and women respectively), than started on an upward trend from 1988-1989, before increasing substantially during 1992 to 1995 (by 84.8% and 74.8% for men and women respectively) (Figures 2-3). From 1995-1998 there was a fall in the rates before they again jumping dramatically between 1998 and 2005 (by 113.9% and 147.5% for men and women respectively). Although the trends in liver cirrhosis mortality rates are rather similar over time series for both sexes, the male mortality rate tends to fluctuated across time series to a much greater extent than the female rate.
-
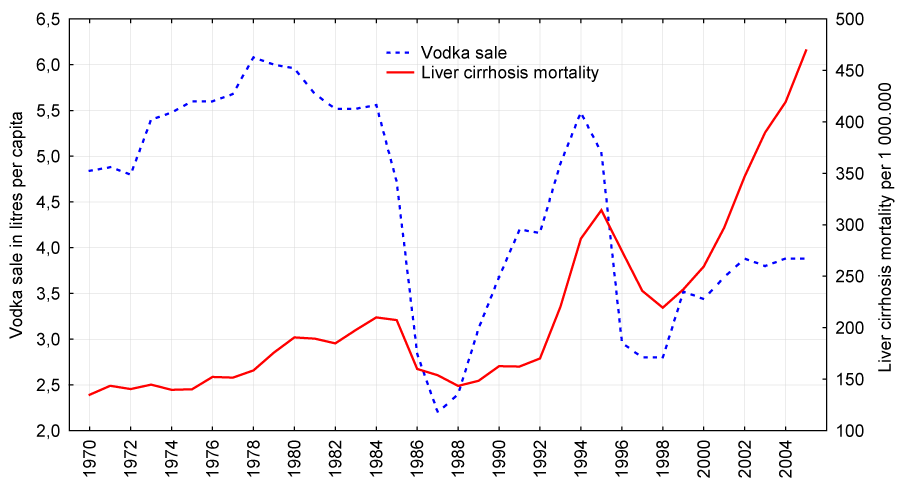
Figure 2:
Trends in male liver cirrhosis mortality rate (right scale) and vodka sale per capita (left scale) in Russia between 1970 and 2005.
-
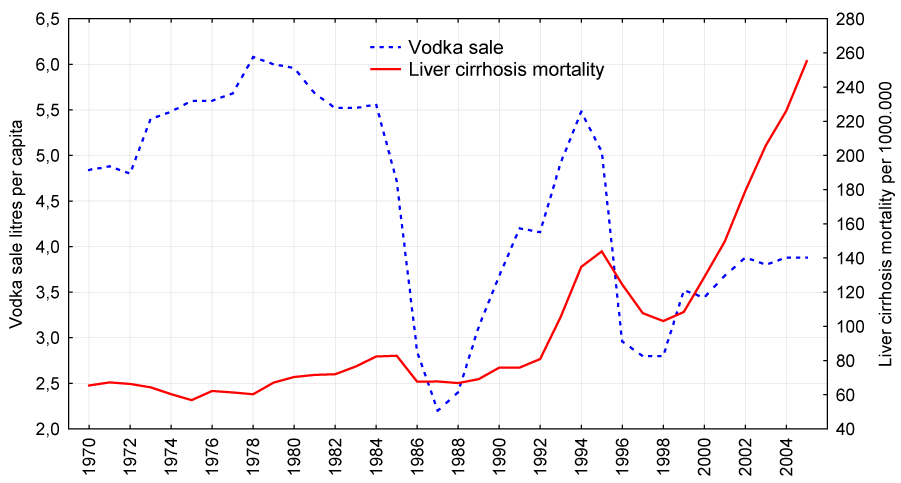
Figure 3:
Trends in female liver cirrhosis mortality rate (right scale) and vodka sale per capita (left scale) in Russia between 1970 and 2005.
The graphical evidence suggests that the trends in both vodka sale per capita and liver cirrhosis mortality for males and females seem to follow each other across the time-series (Figures 1 and 2). There were sharp trends in the time series data across the study period. These trends were removed by means of a first-order differencing procedure. After prewhitening the cross-correlations between alcohol consumption and liver cirrhosis mortality time series were inspected. This indicated that there was a statistically significant cross-correlation between total per capita alcohol sale, vodka and beer sales and liver cirrhosis mortality for males and females at lag zero (Tables 2 and 3). At the same time, there was no cross-correlation between the level of wine sale and liver cirrhosis mortality rates.
-
Table 2:
Effects of beverage specific alcohol sale per capita on liver cirrhosis mortality rate.
The results of cross-correlation analysis between prewhitened time series for males.
-
Table 3:
Effects of beverage specific alcohol sale per capita on liver cirrhosis mortality rate.
The results of cross-correlation analysis between prewhitened time series for females.
The specification of the bivariate ARIMA model and outcome of the analyses are presented in Table 4. According to the results, total alcohol sale is a statistically significant associated with both male and female liver cirrhosis mortality rates, implying that a 1-litre increase in per capita alcohol sale is associated with an increase in male mortality of 17.2% and female mortality of 5.3%. The analysis also suggests that of the three beverages (vodka, beer and wine) vodka alone was associated with liver cirrhosis mortality in Russia. The estimated effects of vodka sales on the liver cirrhosis mortality rate are clearly statistically significant for both sexes: a 1 liter increase in vodka sale would result in a 37.6% increase in the male liver cirrhosis mortality rate and in 9.3% increase in female mortality rate. The association between beer sale per capita and liver cirrhosis mortality rate was also positive for both sexes, but statistically not significant.
-
Table 4:
Estimated effects of beverage specific alcohol sale on liver cirrhosis mortality rates. The results of ARIMA modeling.
* - p < 0.001
The general form of non-seasonal ARIMA model is (p,d,q), where p - the order of the autoregressive parameter, d – the order of differencing, and q – the order of the moving average parameter. Q test for residuals are satisfactory in all models
Discussion
The outcome of the time-series analysis suggests a positive and statistically significant relationship between liver cirrhosis mortality rate and population drinking in Russia. Furthermore, the results of beverage-specific modeling indicated that spirits was the key beverage driving the association between per capita alcohol consumption and liver cirrhosis mortality rate. These results are consistent with the previous findings from other settings that spirits is the most significant beverage-specific predictor of liver cirrhosis mortality [17,18].
In agreement with previous studies [7], we have found significant gender differences in the association between per capita spirits sale and liver cirrhosis mortality rate, which mean that the impact of changes in per capita spirits sale appear to be larger on male liver cirrhosis mortality. Beverage preference and harmful drinking pattern might be responsible for the gender difference in the association between liver cirrhosis mortality rate and vodka sale as vodka continue to be the drinking of choice for the majority of men in Russia, while women not only drink less often than men, but those who do drink, consume vodka less frequently than men. Indeed, according to population survey 44% of men and only 6% women reported that they drink an equivalent of 25 cl of vodka or more at one occasion [33]. According to a more recent study 28% of men and 4% of women consume at least 200g (86+ g of pure alcohol) on one occasion at least once every 2-3 weeks [34].
It is important to point out that the results suggest a fairly quick response of liver cirrhosis mortality rates to changes in vodka sale. The instantaneous response in mortality rates from chronic alcohol-related diseases seem quite surprising when considering the long latency period at the individual level [8]. The reasonable explanation from this seeming inconsistency has been suggested by Norström and Skog [30]. They argue that in a population there exists a reservoir of heavy drinkers who are near the critical threshold-value for a dying from chronic alcohol-related consequences. In case when these high risk individuals increase alcohol consumption during a given year, they will exceed the threshold value and die from alcohol-related diseases. This is the reason why the immediate impact on chronic alcohol related mortality can be registered from marked changes in aggregate consumption.
The stronger association between cirrhosis mortality and spirits sale may be attributable to biological and sociobehavioral mechanisms. A more likely explanation for this finding is that the drinking pattern of spirits users was substantially different from wine or beer users. There is suggestive evidence that consumption of spirits is more closely associated with larger quantities of alcohol consumed per occasion and poor nutrition [35]. The role of binge drinking pattern in modifying the effect of alcohol on the risk of liver cirrhosis has been emphasized in epidemiological and experimental studies [36-38]. Emerging evidence indicate that binge drinking has profound effects on biochemical processes in the liver and amplifies the risk of liver damage [39]. A second possible explanation for these findings is that the heavy drinkers tend to prefer spirits as the least expensive form of alcohol [40].
Before concluding, we should address the potential limitations of this study. A close relationship between per capita alcohol sale and liver cirrhosis mortality does not rule out the possibility that other factors have also influenced the development liver cirrhosis mortality rate. Although alcohol is regarded as the most important risk factor for liver cirrhosis, a number of other causal factors that influence the risk of development of liver cirrhosis have been indentified, including diet, obesity and concomitant infection with viral hepatitis [6]. The presence of these causal factors is likely to have distorted the estimated alcohol effects. It seems that the role of non-alcohol causes in liver cirrhoses mortality increased during the last decade. In particular, the epidemic of viral hepatitis among drug users might contribute to the dramatic increase in liver cirrhosis mortality in Russia during the past several years [41]. It should be also emphasized that the sharp rise in viral hepatitis prevalence, as well as increase in per capita beer sale might actually account for the discrepancies between trends in vodka sale and liver cirrhosis mortality rate in most recent years. However, the etiological importance of other risk factors is clearly modest compared to alcohol, thus limiting their potential influence. Finally, the present analysis is based on fairly short time series and this implies caution in the interpretation of findings.
In conclusion, the findings from present study support the substantial literature which demonstrates a close link between alcohol consumption and liver cirrhosis mortality at aggregate level, and most important, suggests that this relationship is mediated by beverage preference. Assuming that drinking vodka is usually associated with intoxication episodes, these findings provide indirect evidence that substantial proportion of liver cirrhosis deaths in Russia are due to acute effect of binge drinking. The findings from this study suggest that public health efforts should focus on both reducing overall consumption and changing beverage preference away from distilled spirits in order to reduce alcohol-related mortality rates in Russia.
Acknowledgements
The author would like to thank the anonymous reviewers for their valuable comments and suggestions on an earlier version of this paper.
- Jewell J, Sheron N (2010) Trends in European liver death rates: implications for alcohol policy. Cli Med 10: 259-263.
- Leon DA, McCambridge J (2006) Liver cirrhosis mortality rates in Britain from 1950 to 2002: an analysis of routine data. Lancet 367: 52-56.
- Zatonski WA, Sulkowska U, Manczuk M, Rehm J, Boffetta P, et al. (2010) Liver cirrhosis mortality in Europe, with special attention to Central and Eastern Europe. Eu Addict Res 16: 193-201.
- Corrao G (1998) Meta-analysis of alcohol intake in relation to risk of liver cirrhosis. Alcohol & Alcoholism 33: 381-392.
- Gronbaek M, Jensen MK, Johansen D, Sorensen TIA, Becker U (2004) Intake of beer, wine and spirits and risk of heavy drinking and alcoholic cirrhosis. Biol Res 37: 195-200.
- O'Shea RS, Dasarathy S, McCullough AJ (2010) Alcoholic liver disease. Am J Gastroenterol 105: 14-32.
- Rehm J, Taylor B, Moharatra S, Irving H, Baliunas D, et al. (2010) Alcohol as a risk factor for liver cirrhosis: a systematic review and meta-analysis. Drug Alcohol Rev 29: 437-445.
- Norström T, Ramstedt M (2005) Mortality and population drinking: a review of the literature. Drug and Alcohol Rev 24: 537-547.
- Ramstedt M (2001) Per capita alcohol consumption and liver cirrhosis mortality in 14 European countries. Addiction 96: 19-33.
- Ramstedt M (2007) Population drinking and liver cirrhosis mortality: is there a link in Eastern Europe. Addiction 102: 1212-1223.
- Becker U (1998) Liver disease, importance of gender and type of alcohol. Alcohol: Clinical and Experimental Research 22: 139A.
- Longneker MP, Wolz M, Parker DA(1981) Ethnicity, distilled spirits consumption and mortality in Pennsylvania. JStud Alcohol 421: 791-796.
- Bode C, Bode JC, Erhardt JG, French B.A, French SW (1998) Effects of the type of beverage and meat consumed by alcoholics with alcoholic liver disease. Alcohol ClinExp Res 22: 1803-1805.
- Campollo O, Martinez MD, Valencia JJ, Sequra-Ortega J (2001) Drinking patterns and beverage preferences of liver cirrhosis patients in Mexico. Subst Use Misuse 36: 387-398.
- Schmidt W, Broneto J (1962) Death from liver cirrhosis and specific alcoholic beverage consumption: an ecological study. Am J Public Health Nations Health 52: 1473-1482.
- Terris M (1967) Epidemiology of cirrhosis of the liver: national mortality data. Am J Public Health Nations Health 57: 2076-2088.
- Gruenewald PJ, Ponicki WR (1995)The relationship of alcohol sale to cirrhosis mortality. J Stud Alcohol 56: 635-641.
- Roizen R, Kerr WC, Fillmore KM (1999) Cirrhosis mortality and per capita consumption of distilled spirits, United States, 1949-94: trend analysis. BMJ 319: 666-670.
- Kerr WC, Fillmore KM, Marry P (2000) Beverage-specific alcohol consumption and cirrhosis mortality in a group of English-speaking beer-drinking countries. Addiction 95: 339-346.
- Razvodovsky YE (2002) Association between vodka consumption and alcohol-related mortality: a time-series analysis. Adicciones 14: 497-502.
- Jiang H, Livingston M, Room R, Dietzee P, Norström T, et al. (2014) Alcohol consumption and liver disease in Australia: a time series analysis of the period 1935-2006. Addiction 49: 363-368.
- Nemtsov AV (2000) Estimates of total alcohol consumption in Russia, 1980-1994. DrugAlcohol Depend58: 133-142.
- Razvodovsky YE (2013) Estimation of the level of alcohol consumption in Russia. ICAP Periodic Review Drinking and Culture 8: 6-10.
- Nemtsov AV, Razvodovsky YE (2008) Alcohol situation in Russia, 1980-2005. Social and Clinical Psychiatry 2: 52-60.
- Stickley A, Leinsalu M, Andreew E, Razvodovsky YE, Vagero D, et al. (2007) Alcohol poisoning in Russia and the countries in the European part of the former Soviet Union, 1970-2002. Eur JPublic Health 17: 444-449.
- Stickley A, Razvodovsky Y, McKee M (2009) Alcohol and mortality in Russia: A historical perspective. Public Health 123: 20-26.
- Hyman MM (1981) “Alcoholic”, “unspecified” and “other specified” cirrhosis mortality: a study in validity. JStud Alcohol 42: 336-342.
- Norström T (1989) The use of aggregate data in alcohol epidemiology. BrJ Addict 84: 969-977.
- Box GEP, Jenkins GM (1976) Time Series Analysis: forecasting and control. London. Holden-Day Inc.
- Norström T, Skog OJ (2001) Alcohol and mortality: methodological and analytical issue in aggregate analysis. Addiction 96: 5-17.
- Norström T, Razvodovsky Y (2010) Per capita alcohol consumption and alcohol-related harm in Belarus, 1970-2005. EurJ Public Health20: 564-568.
- Razvodovsky YE (2012) Estimation of alcohol attributable fraction of mortality in Russia. Adicciones 24: 247-252.
- Bobak M, McKee M, Rose R, Marmot M (1999) Alcohol consumption in a sample of the Russian population. Addiction 94: 857-866.
- Pomerleau J, McKee M, Rose R, Haerpfer CW, Rotman D, et al. (2008) Hazardous alcohol drinking in the former Soviet Union: a cross-sectional study of eight countries. Alcohol Alcohol 43: 351-59.
- Brandish E, Sheron N (2010) Drinking patterns and the risk of serious liver disease. Expert Rev GastroenterolHepatol 4: 249-252.
- Stranges S, Freudenheim JL, Muti P, Farinaro E, Russell M, et al. (2004) Differential effects of alcohol drinking pattern on liver enzymes in men and women. Alcohol ClinExp Res 28: 949-956.
- Bellentani S, Saccoccio G, Costa G, Tiribelli C, Maxenti F, et al. (1997) Drinking habits as cofactors of risk for alcohol induced liver damage. Gut 41: 845-850.
- Zakkhari S, Li TK (2007) Determinants of alcohol use and abuse: impact of quantity and frequency patterns on liver disease. Hepatology 46: 2032-2039.
- Shukla SD, Pruett SB, Szabo G, Arteel GE (2013) Binge ethanol and liver: new molecular developments. Alcohol ClinExp Res 37: 550-557.
- Razvodovsky YE (2013) Consumption of noncommercial alcohol among alcohol-dependent patients. Psychiatry J ID 691050.
- Poinstil E, Verevochkin SV, Dukhovlinova E, Niccola IL, Barbour R, et al. (2009) Hepatitis C virus infection among drug injectors in St. Petersburg, Russia: social and molecular epidemiology of an endemic infection. Addiction 104: 1884-1890.


Figure 1:
Beverage-specific alcohol sale in Russia between 1970 and 2005.
Figure 1: Beverage-specific alcohol sale in Russia between 1970 and 2005.