


Authors:
James Wiiliam Price*
Clinical Assistant Professor Marian University College of Osteopathic Medicine Indianapolis, Indiana Volunteer Assistant Clinical Professor Indiana University School of Medicine Evansville, Indiana
Received: 17 December, 2016; Accepted: 23 December, 2016; Published: 26 December, 2016
James Wiiliam Price, DO, MPH, University / Organization: St. Mary’s Health System, Affiliations: Clinical Assistant Professor Marian University College of Osteopathic Medicine Indianapolis, Indiana Volunteer Assistant Clinical Professor Indiana University School of Medicine Evansville, Indiana, Tel: 812-485-6900; E-mail:
Price JW (2016) An Examination of the Relationship between Socio-epidemiologic Factors and Positive Workplace Drug Tests in the United States. J Addict Med Ther Sci 2(1): 023-027. DOI: 10.17352/2455-3484.000017
© 2016 Price JW. This is an open-access article distributed under the terms of the Creative Commons Attribution License, which permits unrestricted use, distribution, and reproduction in any medium, provided the original author and source are credited.
Background: An examination of the relationship between social factors and positive workplace drug tests has heuristic value for understanding population vulnerability to subsequent employment disruption.
Methods: This is a retrospective analysis using multiple linear regression comparing annual U.S. rates of marriage, divorce, birth, death, mortgage delinquency, disposable income, property crime, violent crime to annual U.S. workplace drug positivity rates (marijuana, opiates, amphetamines, phencyclidine, cocaine) from 1990 to 2012.
Results: Significant regression coefficients were demonstrated between several of the dependent and independent variables after adhering to strict inclusion criteria and ruling out multicollinearity and first order linear auto-correlation. United States mortgage delinquency rates correlate with high urine marijuana (β = -0.309, p ≤ 0.05) and cocaine positivity rates (β = -0.732, p ≤ 0.05) for the employed segment of the population. Higher U.S. property crime rates correlate with higher workplace urine amphetamine positivity rates (β = 0.429, p ≤ 0.01). Relatively high national violent crime rates correlate with high urine cocaine positivity rates (β = 0.419, p ≤ 0.05) and low urine amphetamine positivity rates β = -0.929, p ≤ 0.05). High marriage rates correlate with high workplace urine marijuana positivity rates (β = 0.760, p ≤ 0.01) and high U.S birth rates correlate with high workplace urine cocaine positivity rates (β = 0.209, p ≤ 0.05).
Conclusions: This study has demonstrated positive and negative associations between the U.S. mortgage delinquency rate, property crime rate, violent crime rate, marriage rate and birth rate with U.S urine drug test positivity rates.
Introduction
Approximately 16% of the U.S. workforce reported using illicit drugs at least once over a twelve month period, and 9.4% report doing so at least once per month [1]. Evidence is mounting that worker substance abuse may be responsible for productivity losses including increased absenteeism and short-term disability, higher turnover, and suboptimal performance at work. Full-time workers that reported using illicit drugs were more likely to report missing two or more workdays in the past month due to illness or injury (16.4 vs. 11.0 percent) and were more likely to have skipped one or more days of work in the past month (16.3 vs. 8.2 percent) [2]. Robert DuPont, MD, former Director of the National Institute on Drug Abuse is quoted as saying “the increases in illicit drug positivity in employment drug testing should get employers and policymakers to take notice of the serious risks these drugs create for productivity, health and safety” [3].
The etiology of substance use and abuse is multifactorial with genetic, psychological, and social determinants. Human beings are communal creatures, and few biologic processes or behaviors are unmediated by their social context [4]. Examination of the features of the “risk environment” and how they may influence substance use fall within the realm of social epidemiologic research [5]. Social epidemiologic observations help to empiricize the relationship between social context and substance use behavior [5]. The contextual nature of external influences provides a useful structure for building and sustaining effective programs targeting workforce drug test positivity rates [6].
An examination of the social epidemiology of workplace drug test positivity rates, a surrogate for workforce drug use, has heuristic value for understanding population vulnerability to disrupted employment as a consequence of positive workplace drug tests. Knowledge of the relationship between drug test positivity rates and external influences, however, is lacking. To address the paucity of information, this study explores the longitudinal relationship between U.S. workplace drug test positivity rates with U.S. crime rates, vital statistics and income measures and provides the first empirical assessment for potential relationships.
Methods and Analysis
I selected 9 independent variables representing 3 experiential domains [7]. First is the family domain, consisting of annual divorce rates, marriage rates, death rates and birth rates. Each rate is based on 1,000 persons. This information was obtained from the Centers for Disease Control National Vital Statistics System [8]. Second is the financial domain which consists of disposable per capita income (chained 2009 dollars), mortgage delinquency rate, and spending per poverty person (inflation adjusted). The ladder variable represents welfare spending including financial support, medical coverage and housing assistance. The mortgage delinquency rates, expressed as a percentage value, were gathered from the U.S. Federal Reserve Bank as quarterly reports which were used to generate the mean value for each year being studied [9]. The remaining information came from the U.S. Bureau of Economic Analysis [10]. Finally we have the crime domain represented by the annual violent crime rates and property crime rates per 100,000 persons. This information was acquired from FBI, Uniform Crime Reports, prepared by the National Archive of Criminal Justice Data [11].
I utilized 5 dependent variables which were obtained from the Quest Diagnostics Drug Testing Index™ [12]. The variables being the annual marijuana positivity rates, opiate positivity rates, amphetamine positivity rates, phencyclidine positivity rates and cocaine positivity rates. Annual data for the positivity rates of each individual drug were available back to 1996. Each rate was expressed as the percentage of positive samples.
The natural logarithm of each variable was calculated to account for lack of normality [13,14]. Listwise deletion was used to remove all data for a case with one or more missing values. Stepwise multiple-regression was performed for each dependent variable. The stepping method entry criterion was 0.05, and the removal criterion was 0.10 for the probability of F. The Durbin-Watson statistic was generated to identify first order linear auto-correlation in the multiple linear regression data. A value between 1 and 3 was considered acceptable. Lagging procedure was used on the dependent variable to attempt remediation for instances of identified first order linear auto-correlation. The adjusted R2 of the model was used to explain the percentage of the variance in the data. ANOVA testing was executed to categorize the presence or absence of a linear relationship between remaining variables in the models. Regression coefficients for the independent variables were evaluated for statistical significance. The beta-coefficients were used to assess each independent variable’s impact upon the dependent variable. Tolerance and variance inflation factor (VIF) values were used to screen for multicollinearity. Multicollinearity was suggested by tolerance values ≤ 0.1 or VIF values > 10.
Results
Descriptive statistics were generated and were indeed non-normally distributed confirming the need for natural logarithmic transformation prior to regression analysis (Table 1).
Marriage rate and mortgage delinquency rate met stepping method criteria for inclusion in the marijuana urine test positivity rate model (Table 2). The adjusted R2 of the model was 0.908 explaining 90.8% of the variance in the data. The Durbin-Watson statistic was acceptable (1.172), indicative of a limited possibility of first order linear auto-correlation in the multiple linear regression data. The F-test was highly significant, indicating a linear relationship between variables in the model. The coefficients for the included independent variables were statistically significant. The beta-coefficient weights indicated that the marriage rates (0.823) had a greater influence then the mortgage delinquency rates (-0.309). The tolerance and VIP values for the marriage rate and divorce rate were not consistent with multicollinearity.
-
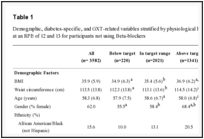
Table 2:
Summary of Multiple Linear Regression Analysis for Variables Predicting Urine Marijuana Positivity Rate (M=1.041; SD=0.1569; N=12).
The divorce rates, violent crime rates, and the property crime rates met stepping method criteria for inclusion in the amphetamine urine test positivity rate model (Table 3). First order linear auto-correlation of the multiple linear regression data was suspected according to the Durbin-Watson statistic which was 0.310. The Lagged natural logarithm of the amphetamine positivity rate was added as an additional independent variable and the divorce rate no longer met stepping criteria. The final adjusted R2 of the model showed the linear regression model explained 95.2% of the variance in the data. The Durbin-Watson statistic was 1.041 indicating that the lagging procedure was an adequate remedy and first order linear auto-correlation was less likely to be present. The F-test is highly significant, consistent with a linear relationship between variables in the model. Regression coefficients for the independent variables were also highly significant. The beta-coefficients by order of weighted impact were violent crime rates (-0.929), the lagged amphetamine variable (0.486), and property crime rates (0.429). The tolerance and VIP values did not identify multicollinearity.
-
Table 3:
Summary of Final Multiple Linear Regression Analysis for Variables Predicting Urine Amphetamine Positivity Rate (M=0.375; SD=0.1189; N=11).
Violent crime rates, mortgage delinquency rates and birth rates met stepping method criteria for inclusion in the cocaine urine test positivity rate regression model (Table 4). The adjusted R2 of the model was 0.956. The Durbin-Watson statistic was 1.535 and we can accept there was no first order linear auto-correlation in the regression data. The F-test was highly significant indicating a linear relationship between variables in the model. The remaining independent variables were each highly statistically significant. The beta-coefficients indicate the mortgage delinquency rates (-0.732) had the greatest influence, then the violent crime rates (0.419) and finally the birth rates (0.209). The tolerance and VIP values did not indicate the presence of multicollinearity.
-
Table 4:
Summary of Multiple Linear Regression Analysis for Variables Predicting Urine Cocaine Positivity Rate (M=-0.350; SD=0.2084; N=12).
Stepwise multiple-regression was performed and spending per poverty person was the only variable that met stepping method criteria for inclusion in the phencyclidine urine test positivity rate model (Table 5). The Durbin-Watson statistic was 0.739, consistent with first order linear auto-correlation in the data. Lagging of the natural logarithm of the phencyclidine positivity rate failed to remedy the first order auto-correlation and further analysis was stopped. None of the variables met criteria for inclusion in the opiate urine test positivity rate stepwise multiple regression model and analysis could go no further. It should be noted that the two models that failed to produce usable outcomes were for the two drugs with the lowest urine test positivity rates.
-
Table 5:
Summary of Linear Regression Analysis for Variables Predicting Urine Phencyclidine Positivity Rate (M=-4.051; SD=0.3532; N=12).
Discussion
This study presents a novel examination of the relationship between social context and workplace drug test positivity rates on a national level. Low U. S. mortgage delinquency rates, an indicator of a strong economy, correlate with high urine marijuana and cocaine positivity rates for the employed segment of the population. This finding is consistent with a cross-sectional study of 23,482 Swedish men that found lower socioeconomic status was associated with a lower likelihood of marijuana use [15]. A possible explanation for the cocaine finding may be that neighborhoods become blighted as foreclosures occur. Neighborhood disadvantage is moderately correlated with substance use behaviors even when controlling for individual socioeconomic status [16]. In fact, research suggests that neighborhood income and income distribution may play more important roles in determining population use of marijuana than individual income [17].
This study determined that higher U.S. property crime rates correlate with higher workplace urine amphetamine positivity rates. The relationships among drug offenses, property crime, and the allocation of police resources were explored in a structural model using data from Florida counties. The data suggested that rising property crimes in Florida were at least partly the result of diverting resources from fighting property crime to combating drug related crime [18].
Relatively high national violent crime rates correlate with high urine cocaine positivity rates and low urine amphetamine positivity rates for the workforce. Illicit drugs are often present in both offenders and victims of violent crimes. In addition to psychopharmacological effects of the abused drug, substance use may lead to violence through related social practices such as drug trafficking and dealing, as well as, violence used to obtain drugs or money to purchase drugs [19]. There is considerable economic research suggesting a stronger causal relationship between drug enforcement, control and prohibition with violent crime, than drug use with criminal violence [20].
High marriage rates correlate with high workplace urine marijuana positivity rates and high U.S birth rates correlate with high workplace urine cocaine positivity rates. These findings contradict previous studies. For example, more stable family connections have been shown to be associated with a lower likelihood of marijuana use [21]. Also, the assumption of greater family responsibilities most notably becoming a parent for the first time has been linked with cessation of marijuana use [22].
Opiate positivity rates did not correlate with any of the variables examined from within the family, financial or crime domains. These findings agree with a recent investigation that determined a greater association between major adverse life events and stimulate use but not and little to no association with opiate use [23]. In addition, the relationship between opiate use and non-violent crime has not well established [24]. Also, this study failed to provide evidence for a relationship between phencyclidine positivity rates and violence which has been established in past work [25]. I found no recent work linking phencyclidine use to financial or family status.
The models used in this study support the existence of associations between several of the independent variables and three of the dependent variables. Nonetheless this study does have limitations. Residual confounding may be an issue with some of the independent variable data sources as reporting mechanisms vary amongst law enforcement agencies and financial institutions. The sample size was suboptimal but this could not be helped due to the limited number of years for which workplace drug testing has been reported. At first glance covariate imbalance between the dependent and independent variable populations appear to be a concern. However, this was necessary for the purpose of this study which was to examine the relationship between demographic and social characteristics of the U.S. general population and the rate of positive drug tests for the working sub-population of the U.S. general population. Lastly, I was not able to control for race, education, type of employment or gender, thereby failing to address the potential impact of confounding or effect modification.
Associations observed between variables on an aggregate level may not reflect associations that exist on an individual level and no direct or indirect causal inference can be made with these results. Regression models do not take into account the interrelated, dynamic factors across different levels of influence that shape health related behavior [5]. The results are meant to provide information to occupational health professionals and policy makers regarding tailoring programs designed to decrease workplace drug positivity rates.
Summary
This study has demonstrated positive and negative associations between the U.S. mortgage delinquency rate, property crime rate, violent crime rate, marriage rate and birth rate with U.S urine drug test positivity rates. This appears to be the first study revealing such a relationship. This information can be used to customize prevention programs relative to the studied external correlates. A direction for future research is to determine whether directed workplace substance use prevention program changes, based on evolving social characteristics, positively affect urine drug test positivity rates.
- Frone M (2013) Alcohol and illicit drug use in the workforce and workplace. Washington, DC: American Psychological Association; 2013. Link: https://goo.gl/wYvSr8
- Larson S, Eyerman J, Foster M, Groerer J (2007) Worker Substance Use and Workplace Policies and Programs; DHHS Publication No. SMA 07-4273, Analytic Series A-29. Rockville, MD: Substance Abuse and Mental Health Services Administration, Office of Applied Studies. Link: https://goo.gl/B7bOMH
- Quest Diagnostics (2016) Illicit drug positivity rate increases sharply in workplace testing. Link: https://goo.gl/NbcGZS
- Galea S, Nandi A, Vlahov D (2004) The Social Epidemiology of Substance Use. Epidemiologic Reviews 26: 36-52. Link: https://goo.gl/YvfKL7
- Galea S, Hall C, Kaplan G (2009) Social epidemiology and complex system dynamic modelling as applied to health behavior and drug use research. Int J Drug Policy 20: 209–216. Link: https://goo.gl/xID7wG
- Rhodes T (2002) The ‘risk environment’: a framework for understanding and reducing drug-related harm. Int J Drug Policy 13: 85-94. Link: https://goo.gl/Yk2iiu
- Holmes TH, Rabe RH (1967) The social readjustment rating scale. Journal of Psychosomatic Research 11: 213-218. Link: https://goo.gl/x74HXX
- Centers for Disease Control and Prevention (2015) National Vital Statistics System. January 15, 2015. Link: https://goo.gl/iayMo3
- U.S. Federal Reserve (2015) Charge-off and Delinquency Rates on Loans and Leases at Commercial Banks. February 18, 2015. Link: https://goo.gl/rgRYGJ
- U.S. Bureau of Economic Analysis. National Economic Accounts (2015) February 27, 2015. Link: https://goo.gl/03vFzW
- U.S. Department of Justice (2015) Uniform Crime Reporting Data Online. March 29, 2015.Link: https://goo.gl/36RCIG
- Quest Diagnostics (2014) Quest Diagnostics Drug Testing Index Archives. 2014. Link: https://goo.gl/HQ198u
- Bland JM, Altman DG (1996) Statistics notes. Logarithms. BMJ 312: 700. Link: https://goo.gl/PgaNUi
- Bland JM, Altman DG (1996b) Transforming data. BMJ312: 770. Link: https://goo.gl/KaAIkO
- Stenbacka M, Allebeck P, Romelsjo A (1993) Initiation into drug abuse: the pathway from being offered drugs to trying cannabis and progression to intravenous drug abuse. Scand J Soc Med 21: 31–39. Link: https://goo.gl/oW2MpZ
- Boardman J, Finch B, Ellison C, Williams D, Jackson J (2001) Neighborhood disadvantage, stress, and drug use among adults. J Health Soc Behav 42: 151-165. Link: https://goo.gl/O8jQvr
- Galea S, Ahern J, Tracy M, Vlahov D (2007) Neighborhood income and income distribution and the use of cigarettes, alcohol, and marijuana. American Journal of Preventive Medicine 32: S195-S202. Link: https://goo.gl/MGnl4l
- Benson B, Kim I, Rasmussen D, Zuhlke T (1992) Is property crime caused by drug use or by drug enforcement policy? Applied Economics 24: 679-692. Link: https://goo.gl/8jiXa1
- Boles S, Miotto K (2003) Substance abuse and violence: A review of the literature. Aggression and Violent Behavior 8: 155-174. Link: https://goo.gl/5cTNHK
- Resignato AJ (2000) Violent crime: a function of drug use or drug enforcement? Applied Economics 32: 681-688. Link: https://goo.gl/eA68n5
- Grunbaum JA1, Tortolero S, Weller N, Gingiss P (2000) Cultural, social, and intrapersonal factors associated with substance use among alternative high school students. Addict Behav 25: 145–151. Link: https://goo.gl/xxgICt
- Chen K, Kandel D (1998) Predictors of cessation of marijuana use: an event history analysis. Drug Alcohol Dependence 50: 109–121. Link: https://goo.gl/v3kROu
- Myers B, Mclaughlin K, Wang S, Blanco C, Stein D (2014) Associations between childhood adversity, adult stressful life events, and past-year drug use disorders in the National Epidemiological Study of Alcohol and Related Conditions (NESARC). Psychol Addict Behav 28: 1117-1126. Link: https://goo.gl/Ex9Clu
- Hayhurst K, Pierce M, Hickman M, Seddon T, Dunn G. et al. (2016) Pathways through opiate use and offending: a systematic review. Int J Drug Policy 39: 1-13. Link: https://goo.gl/Q3AVub
- Crane C, Easton C, Devine S (2013) The association between phencyclidine use and partner violence: an initial examination. J Addict Dis 32: 150-157. Link: https://goo.gl/913ngf


Table 1:
Descriptive statistics prior to natural logarithmic transformation.
(chained 2009 dollars)
(inflation adjusted)