


Author(s):
Gioia A1, Manco R2, Tenaglia R.L2, Tirabassi G1* and Balercia G1
1Endocrinology Unit, Polytechnic University of Marche, Ancona, Italy
2Department of Urology, University of Chieti, Chieti, Italy
Received: 16 Septmebr, 2014; Accepted: 22 October, 2014; Published: 24 October, 2014
Giacomo Tirabassi, Endocrinology Unit, Polytechnic University of Marche, Ancona, Italy, Tel: +390715963738; Fax: +390715964741; Email:
Gioia A, Manco R, Tenaglia RL, Tirabassi G, Balercia G (2015) Relationship between BMI, PSA and Histopathological Tumor Grade in a Caucasian Population Affected by Prostate Cancer. Global J Med Clin Case Reports 2(1): 014-019. DOI: 10.17352/2455-5282.000013
© 2015 Gioia A, et al. This is an open-access article distributed under the terms of the Creative Commons Attribution License, which permits unrestricted use, distribution, and reproduction in any medium, provided the original author and source are credited.
Obesity; Prostate Cancer; Gleason Score; Body Mass Index
The aim of this work is to show the relationship between obesity and aggressivenes of Prostate Cancer. We conducted a retrospective study of 132 men affected by Prostate Cancer underwent radical prostatectomy. Gleason score was abstracted by biopsy specimens and by post-operatory specimens. We evaluated PSA level and Body Mass Index (BMI). The prevalence of Post Operative Gleason Score > 8 among subjects with lowest tertile of PSA was higher in obese (BMI > 30 Kg/m2) (94.4%) vs overweight subjects (BMI 25-29.9 Kg/m2) (19.2%) (p< 0.01); the prevalence of Post Operative Gleason Score >8 among subjects with second tertile of PSA was higher in obese (100%) and overweight (70%) vs normal weight subjects (0%) (p<0.01 and p<0.001 respectively); the prevalence of Post Operative Gleason Score >8 among subjects with third tertile of PSA was higher in obese (100%) and overweight (62%) vs normal weight subjects (0%) (p<0.05 respectively).We believe that changes in the levels of PSA and Gleason Score, observed as a function of class BMI, could be due to separate mechanisms: PSA levels could be influenced by the effect of dilution by increased plasma volume of the subjects obese, while tumor grade could be affected by the hormonal changes induced by adipose tissue.
Introduction
Prostate Cancer (CaP) is the most commonly diagnosed malignancy in men from industrialized countries [1]. Race, familyhistory and age are the most common established risk factors associated with prostate cancer development [2-4].
Numerous studies report the existence of interlinked exogenous and endogenous factors involved in the induction and progression of CaP. Lifestyle factors, for example physical activity and eating habits, such a higher intake of dietary fat, play a significant role in the pathogenesis of CaP [5,6].
Several studies have suggested that obesity, defined as a Body Mass Index (BMI) > 30 Kg/m2 is associated with several hormones changes that have been related to a more aggressive CaP [7,8]. A recent study showed that periprostatic adipose tissue has the potential to modulate CaP aggressiveness, through the increase of periprostatic adipose metabolic activity that stimulates the progression of cancer cells [9]. Moreover, a previous report showed an association of periprostatic adipose tissue thickness with CaP severity [10].
There are several mechanisms by which obesity is thought to promote adverse CaP outcomes. Biological mechanisms include altered levels of circulating hormones that may promote prostate cancer aggressiveness including insulin, insulin-like growth factor 1, leptin and adiponectin as well as dysregulation of sex hormone pathways leading to altered testosterone and estradiol levels [11].
Obesity has been showen to be associated with lower serum Prostate Specific Antigen (PSA) levels mainly due to increased plasma volume among men with large body habitus and lowered PSA among men with increased BMI has been found in a number of reports [12-15].
The primary objective of this study was to analyse the relationship between BMI, PSA and tumor grade of CaP postoperative specimen.
Materials and Methods
From January 2011 to July 2012 we heve recruited 132 consecutive patients with CaP. All patients were diagnosed by increased PSA (Tosoh AIA-Pack Tumor Panel), positive digital rectal exploration and subsequent ultrasound-guided prostate biopsy, after giving informed consent.
Radical retropubic prostatectomy was performed using a 4-suture reconstructive urethrovescical anastomosis at the 2,4,8 and 10 o'clock positions. All patients underwent bilateral pelvic lynphadenectomy and before wound closure in all cases two drains were placed.
Exclusion criteria included subjects over 80 years of age, patients who had a history of CaP or prostate surgery, patients taking finasteride or dutasteride, individuals with PIN (prostatic intraepithelial neoplasm), subjects with repeated negative biopsy and high PSA, individuals with atypical prostate hyperplasia, subjects with other associated urological tumors, individuals with an indwelling bladder catheter, subjects with chronic diseases such as renal, liver or respiratory failure, current androgen supplementation use, patients with metastatic CaP or radiotherapy pretreatment. We recorded patient' smoking habits.
All patients had 10 cores taken during the biopsy procedure that was performed according to a standard departmental protocol [16].
Gleason score was identified by biopsy specimens and by postoperative specimens to define tumor aggressiveness by a single pathologist: Gleason score ≤5 (low), Gleason scores 6-7 (intermediate) and Gleason Score > 8 (high) [17]. Before the biopsy procedure, patients underwent a detailed physical examination, including height and weight measurements. BMI was calculated as weight in kilograms divided by height in meters, squared (Kg/m2). All men were assigned into World Health Organization (WHO)-defined groups based on calculated BMI as follows: normal weight (< 25 Kg/m2), overweight (25-29.9 Kg/m2), and obese (> 30 Kg/m2).
We evaluated the distribution of the individual variables of independent samples. As the distribution of the studied variables was abnormal, the samples were compared with Kruskal Wallis when they were above two in order to define a trend; the comparison between couples of samples was performed with the Mann Withnei test. No-parametric variables were compared with Chi-square. The relationship between variables was assessed by bivariate correlation and partial correlation with removal of the effects of confounding factors. The odds ratio for the development of aggressive tumors was calculated between two classes of risk, with a confidence interval of 95%. A p-value of 0.05 or less was considered statistically significant. Statistical analysis was performed using the SPSS 17.0 software.
Results
The study population consisted of 132 patients who underwent radical retropubic prostatectomy. The mean age was 67 (51-79) years (caucasian population). Clinical characteristics of the whole population are summarized in (Table 1).
The prevalence of overweight was higher (56.8%) vs normal-weight (25%) and obese (18.2%) respectively (p< 0.001).
PSA levels decreased as a function of BMI category: 8.5-7.9-6.0 ng / ml in the normal weight, owerweight and obese group respectively (p <0.001). The values of Post-Operative Gleason Score (POGS) and Biopsy Gleason Score (BSG) increased as a function of BMI category: 5-7-8 and 5-6-7 respectively (p <0.001) (data not shown).
In the whole population the values of BGS were lower than the values of POGS: 6 vs 7 (p <0.001); in normal weight the values of BGS and POGS did not differ significantly, however, in overweight and obese subject lower values of BGS (6 and 7 respectively) compared to POGS were found (7 and 8 respectively) (p <0.001 respectively) (data not shown). We did not find any significant differences between normal weights, overweight and obese categories for age and smoking status.
In the category of subjects with BMI< 25 kg/m2 (mean age 65 anni, median BMI 23,9 kg/m2 )we noted the highest prevalence of POGS ≤ 5 (81.8%) vs POGS= 6-7 (18.2%) and POGS≥ 8 (0%) (p <0.01 and p< 0.001 respectively), we did not find differences in age, PSA levels and smoking status in these three classes of POGS. In the category of subjects with BMI= 25-29.9 Kg/m2 (mean age age 68 anni, median BMI 26,8 kg/m2) we recorded the highest prevalence of POGS> 8 (49.3%) and POGS= 6-7 (50.7%) vs POGS ≤ 5 (0%) (p< 0.0001 respectively). No difference in age between the three classes of POGS was found; however, they differed in the levels of PSA: 6.88 ng/ml in POGS= 6-7 compared to 8.86 ng/ml in POGS> 8 (p<0.01) and in the smoking status: non-smokers in POGS= 6-7 (23.7%) compared to non-smokers in POGS> 8 (62.2%) (p< 0.05). In the category of subjects with BMI>30 Kg/m2 (mean age 66 anni, median BMI 31,3 kg/m2) we noted the highest prevalence of POGS> 8 (95.8%) vs POGS< 5 (0%) and POGS= 6-7 (4.2%) (p<0.0001 respectively); we did not find a difference in age, PSA levels and smoking status in these classes of POGS (Figure 1A).
-
Figure 1a:
Prevalence of subjects with low, medium and high POGS in the three classes of BMI.
*All p <0.05; # p<0,0001 for POGS <5 vs POGS 6-7 and POGS >8; ¥ p<0.0001 for POGS >8 vs POGS <5 and POGS 6-7.
All subjects with POGS ≤5 (mean age 65 anni, median BMI 24,0 kg/m2) showed a level of BMI< 25 kg/m2; among subjects with POGS= 6-7 (mean age 67 anni, median BMI 26,3 kg/m2) the prevalence of BMI= 25-29.9 kg/m2 (84.4%) was higher than the prevalence of BMI <25 kg/m2 (13.3%) and BMI> 30 kg/m2 (2.2%) (p <0.0001 respectively); we did not find significant differences for age, PSA levels and smoking status in these three subclasses. Among subjects with POGS> 8 (mean age 67 anni, median BMI 28,1 kg/m2) the prevalence of BMI= 25-29.9 Kg/m2 (61.7%) and BMI> 30 Kg/m2 (38.3%) was higher than the prevalence of BMI<25 Kg/m2 (0%) (p< 0.0001 respectively) (Figure 1B); we did not find significant differences in age and smoking status in this subclass of BMI, however PSA levels differed: they were higher in the subclass of BMI= 25-29.9 Kg/m2 (17.72 ng/ml) compared to subclass of BMI> 30 Kg/m2 (5.98 ng/ml) (p< 0.0001).
-
Figure 1b:
Prevalence of normal weight, overweight and obese subjects in three classes of POGS.
*p<0.0001for BMI<25 Kg/m2 vs BMI 25-29.9 Kg/m2 and BMI >30 Kg/m2; #p<0.0001 for BMI 25-29.9 Kg/m2 vs BMI<25 Kg/m2 and BMI>30 Kg/m2; ¥p<0.0001 for BMI<25 Kg/m2 vs BMI 25-29.9 Kg/m2 and BMI>30 Kg/m2.
PSA levels were higher in subjects with POGS ≤5 (8.34 ng/ml) vs POGS= 6-7 (7.01 ng/ml) (p< 0.01); there were no significant differences in PSA levels between subjects with POGS > 8 compared to other POGS. The levels of BMI increased as a function of POGS (p for trend < 0.001) (Figure 1C).
BMI, considered as a continuous variable, correlates inversely with levels of PSA (r= -0.188; p< 0.05) and correlates directly with POGS (r= 0.560; p<0.01); the correlation between BMI and POGS remained direct and significant after removing the confounding factors (Table 2).
-
Figure 1c:
Profile of PSA and BMI levels in three classes of POGS.
The three group are not different for age and smoking status. * p<0.01 for PSA in POGS<5 vs PSA in POGS 6-7. # All p <0.001.
-
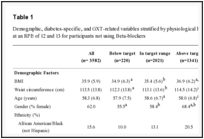
Table 2:
Correlation of BMI, PSA and POGS. When the relationship was significative at univariate analysis, it was adjusted for confonder at multivariate analysis. The variables of control were alwayes age and smoking status; the POGS, BMI, PSA were variables of control whenever appropriate. *p<0.05, #p<0.01
PSA levels correlates inversely with POGS (r= -0.211; p<0.05): this correlation was not significant after removing the confounding factors (Table 2).
The risk of having a high-grade cancer was higher in obese than non-obese: Odds Ratio 23.62 (95%), CI 3.03- 183.98 (data not shown).
We meet with high median values of POGS in the obese class regardless of the tertiles of PSA (p for trend <0.0001) figure 2A).
The prevalence of POGS> 8 among subjects with the lowest tertile of PSA was higher in subjects with BMI> 30 Kg/m2 (94.4%) vs BMI= 25-29.9 Kg/m2 (19.2%) (p<0.01), among subjects in the second tertile of PSA was higher in the obese (100%) and overweight (70%) subgroups vs normal weigh (0%) p<0.01 and p<0.001 respectively, among subjects of third tertile of PSA was higher in the obese (100%) and overweight (62%) subgroup vs normal weight (0%) (p<0.05 respectively). The prevalence of POGS ≤5 between subjects of the second and third tertile of PSA was higher in the group with BMI <25 Kg/m2 (76% and 91% respectively) compared to the group with BMI= 25-29.9 Kg/m2 (0% and 0% respectively) (p< 0.001 and p< 0.0001 respectively) (Figure 2B).
-
Figure 2a:
Profile POGS levels as function of categories of BMI and terzile of PSA.
Tertiles of PSA levels: I tertile (< 6.99 ng/ml), II tertile (6.99-8.94 ng/ml), III tertile (>8.94 ng/ml). G1=BMI<25 Kg/m2 and PSA II tertile; G2=BMI <25 Kg/m2 and PSA III tertile; G3=BMI 25-29.9 Kg/m2 and PSA I tertile; G4=BMI 25-29.9 Kg/m2 and PSA II tertile; G5= BMI 25-29.9 Kg/m2 and PSA III tertile; G6=BMI>30 Kg/m2 and PSA I terzile; G7=BMI>30 Kg/m2 and PSA II tertile; G8=BMI>30 Kg/m2 and PSA III tertile. We have not found subjects with BMI<25 and PSA I terzile. The eighth group is not different for age and smoking status, while G3 has higher prevalence of no smoker vs G4 (15.4% and 65% respectively, p<0.05).
-
Figure 2b:
Prevalence of low, medium and high grade of POGS as function of category of BMI and tertile of PSA. Lower prevalence of POGS>8 in G3 vs G4 and G5 p<0.05 respectively; higher prevalence of POGS 6-7 and lower prevalence of POGS>8 in G3 vs G6 p<0.01 respectively; higher prevalence of POGS<5 and lower prevalence of POGS>8 in G1 vs G4 p<0.001 respectively; higher prevalence of POGS>8 in G7 vs G1 p<0.01; higher prevalence of POGS<5 and lower prevalence of POGS>8 in G2 vs G5 p<0.0001 and p<0.01 respectively; higher prevalence of POGS>8 in G8 vs G2 p<0.05.
Discussion
In our study we confirmed the relationship, between PSA and BMI. PSA levels are lower in obese than non-obese subjects [12,16], however, the inverse relationship between these two variables lose significance in multivariate analysis. Banez et al. supported the theory that obesity does not negatively impact the accuracy of PSA testing among men of varying BMI [18]. A study showed that in three distinct CaP cohorts, all having undergone radical retropubic prostatectomy, hemodilution from increased plasma volume may be responsible for the observed decreased PSA concentration in men with higher BMI; given that PSA is under androgen control, an alternative explanation for the lower PSA concentration is lower testosterone levels among obese men. If this is true, obese men would be expected to have lower PSA mass (which reflects the total amount of PSA protein in circulation); however, in this study obese men had similar or higher PSA mass compared to non-obese subjects [12].
De Nunzio et al. in a group of 650 patients confirmed that PSA could not be used to distinguish prostate cancer from benign disease or high grade prostatic intraepithelial neoplasia [19]; Lopez Fontana et al. [6] in 40 men between 50 and 80 years old (20 with CaP and 20 healthy men as control group) and Jayachandran et al. [20] in 1415 men who underwent radical prostatectomy, showed that higher BMI was associated with higher tumor grade. We confirmed these results, in fact we reported tumor grade increases with increasing the degree of BMI independently of PSA levels; moreover the prevalence of tumor grade is a function of the class of BMI.
De Nunzio et al. showed that patients with high-grade tumors have a higher BMI than patients with low tumor grade and that the prevalence of obesity is higher in patients with Gleason> 7 compared with Gleason = 6; we showed that the prevalence of BMI grade is a function of Gleason Score; nevertheless they have reported that age, BMI and PSA are independent predictors of high grade disease in patients with CaP diagnosed at biopsy. However they detected a level of PSA higher among patients with high-grade tumor compared to subjects with low-grade [21], while in our study we found high levels of PSA in patients with low-grade tumors than in patients with Gleason score 6-7.
Fowke et al. [22] showed that BMI greater than 30 was significantly associated with an increased risk of high grade CaP among men without prostate enlargement, but not among men with prostate enlargement. Together with another study, this suggests that it is more difficult to detect an association between obesity and CaP in the presence of obesity-driven prostate enlargment [23].
Pruthi SR et al., in a series of 500 men who had undergone ultrasound-guided prostate biopsy after abnormal digital rectal exploration or elevated PSA level, observed that obese men had a larger prostate and were less likely to have any abnormality on digital rectal exploration, moreover they did not observe differences in the incidence of higher grade tumors in obese and nonobese men [24].
Gallina et al. in a study of 1.814 men showed that obesity does not predispose a more aggressive CaP at biopsy, in contrast to our statements. Similarly, obesity does not change the ability to identify those who may harbor a high grade tumor at radical prostatectomy. In consequence, the consideration of obesity might be omitted from CaP detection or diagnostic schemes [25].
In our study we demonstrated that overweight and obese patients in the Gleason score biopsy is underestimated compared to Gleason score obtained on the specimen; therefore to evaluate the relationship between Gleason Score, BMI and PSA we used the value obtained from the surgical specimen (POGS). In our study the majority of patients were overweight, as reported in the study of Gallina et al. [25]. We showed that in an obese population, the prevalence of high-grade cancers did not change with the tertiles of PSA; in the overweight class the high grade tumor prevails among subjects with PSA in the highest tertile; in addition our study population showed levels of PSA minimum of 4.7 ng / ml. We therefore think that the relation between high tumor grade and high levels of BMI is not exclusively explained by a delay due to the low levels of PSA typical of obese or overweight subject, as it is reported by others authors [25,26].
Because the prevalence of high-grade tumors tends to increase in the degree of BMI and the prevalence of low-grade tumors tends to decrease as a function of the degree of BMI, independently of PSA tertiles, we believe that the BMI can explain these findings through one of the following mechanisms: i) obesity, through the imbalance of the endocrine system, may contribute to the degree of malignancy of cancer; ii) the lifestyle that leads to obesity may be implicated in the aggressiveness of the tumor; ii) both the above hypotheses. In the category of subjects with BMI<25, POGS 8 was 0%; in the category of subjects with BMI25-29.9, POGS<6 was 0%; in the category of subjects with BMI>30, POGS<6 was 0%. Probably these results are due to a small sample.
Fowke et al. [22] in a group of 809 men with CaP found that BMI was significantly associated with high grade of CaP not mediated by leptin or C-peptide, suggesting the involvement of other pathway. Thompson et al. in a study of 18.882 men 55 year of age or older showed that seven years of finasteride treatment resulted in a 24.8% reduction in the prevalence of CaP during that period, however, the prevalence of high-grade tumors is greater compared to the control group. The possible explanations are: i) finasteride induces high grade tumors by reducing the level of intracellular dihydrotestosterone within the prostate; ii) finasteride selects for high-grade tumors by selectively inhibiting low-grade tumors [23]. There is evidence that the prostate tumors that develop in men with low testosterone levels have higher Gleason grades and worse outcomes than the CaPs that develop in men with normal testosterone levels [27]; and also known an inverse relationship between BMI and testosterone levels in males [28,29]. It would welcome further studies to establish that obesity may contribute to the development of a more aggressive CaP phenotype. If these hypotheses are confirmed by further studies, it would be possible to establish that obesity, by reducing the levels of testosterone may contribute to the development of more aggressive forms of prostate cancer. We hypothesize that the low PSA level showed in obese subjects may be interpreted as a consequence of the low levels of androgens, nevertheless Bañez et al. in two cohorts of over 1000 subjects underwent radical prostatectomy for CaP found that PSA mass did not change significantly with increasing BMI [12].
Lopez Fontana et al. [6] established a relationship between BMI and the intake of macro and micronutriente with CaP, and it was concluded that an unhealthy diet is associated with the development of prostate cancer, but does not seem to interfere with a direct mechanism on aggressiveness of prostate cancer.
The absence of blood levels of testosterone and a specific parameter of hemodiluition are clear limitations of our study, in fact, these factors may be useful to confirm the hypothesis that we proposed.
Conclusions
Our study is the first to demonstrate the relationship between BMI and aggressiveness of CaP independently of PSA levels. Moreover we reported PSA levels decreased as a function of BMI category. We believe that changes in the levels of PSA and Gleason Score, observed as a function of class BMI, could be due to separate mechanisms, in particular, PSA levels could be influenced by the effect of dilution due to increased plasma volume of the subjects obese, while tumor grade could be affected by the hormonal changes induced by adipose tissue. The hypothesis of a relationship between obesity, PSA and aggressiveness of CaP remains an interesting area of research, although no conclusive data can yet be drawn.
Acknowledgements
The authors thank the staff of the Urology Clinic of Chieti paramedic for the management of patients with cancer therapeutic itinerary.
- Jemal A, Bray F, Center M (2011) Global cancer statistics. CA Cancer J Clin 61: 69-90.
- Barocas DA, Penson DF (2010) Racial variation in the pattern and quality of care for prostate cancer in the USA: mind the gap. BJU Int 106: 322–328.
- Saarimäki L, Tammela TL, Määttänen L (2014) Family history in the finnish prostate cancer screening trial. Int J Cancer 1. doi 10.1002/ijc.29243.
- Uzun D, Yanar K, Atukeren P (2014) Age-related changes in rat prostate tissue; perspective of protein oxidation. Aging Male 28: 1-6
- Wolf AM, Wender RC, Etzioni RB (2010) American Cancer Society Prostate Cancer Advisory Committee: American cancer society guidelines for the early detection of prostate cancer: update. CA Cancer J Clin 60: 70-98.
- Lopez Fontana CM, Recalde Rincon GM, Messina Lombino D (2009) Body mass index and diet influence the development of prostate cancer. Act Urol Esp 33: 741-746.
- Freedland SJ, Banez LL, Sun LL (2009) Obese men have higher-grade and larger tumors: an analysis of the duke prostate center database. Prostate Cancer Prostatic Dis 12: 259-263.
- Isbarn H, Ieldres C, Budans L (2009) Effect of body mass index on hystopathologic parameters: resultz of large European contemporary consecutive open radical prostatectomy series. Urology 73: 615-619.
- Ribeiro RJ, Monteiro CP, Cunha VF (2012) Tumor cell-educated periprostatic adipose tissue acquires an aggressive cancer-promoting secretory profile. Cell Physiol Biochem 29: 233-240.
- Van Roermund JG, Hinnen KA, Tolman CJ (2011) Periprostatic fat correlates with tumor aggressiveness in prostate cancer patients. BJU Int 107: 1775-1779.
- Buschemeyer WC 3rd, Freeland SJ (2007) Obesity and prostate cancer: epidemiology and clinical implications. Eur Urol 52(2) 331-343.
- Banez LL, Hamilton RJ, Partin AW (2007) Obesity-related plasma hemodilution and PSA concentration among men with prostate cancer. JAMA 298: 2275-2280.
- Kubota Y, Seike K, Maeda S (2011) Relationship between prostate-specific antigen and obesity in prostate cancer screening: analysis of a large cohort in Japan. Int J Urol 18: 72-75.
- Grubb RL, III, Balck A, Izmirlian G (2009) Serum prostate-specific antigen hemodilution among obese men undergoing screening in the prostate, lung, colorectal, and ovarian cancer screening trial. Cancer Epidemiol Biomarkers Prev 18: 748-751.
- Wright JL, Lin DW and Stanford JL (2011) The effect demographic and clinical factors on the relationship between BMI and PSA levels. The Prostate 71: 1631-1637.
- Presti JC jr (2003) Prostate biopsy: how many cores are enough? Urol Oncol 21: 135-140.
- Partin AW, Mangold LA, Lamm DM (2001) Contemporary update of the prostate cancer staging nomograms (PARTIN tables) for the new millennium. Urology 58: 843-848.
- Banez LL, Albisinni S, Freeland SJ (2014) The impact of obesity on the predictive accuracy of PSA in men undergoing prostate biopsy. World J Urol 32: 323-328.
- De Nunzio C, Trucchi A, Miano R (2009) The number of positive cores for HGPIN on initial biopsy is associated with prostate cancer on second biopsy. J Urol 181: 1069-1074.
- Jayachandran J, Banez LL, Aronson WJ (2009) Obesity as a predictor of adverse outcome across black and white race: results from the Shared Equal Access Regional Cancer Hospital (SEARCH) Database. Cancer 115: 5263-5271.
- De Nunzio C, Freedland SJ, Miano L (2011) The uncertain relationship between obesity and prostate cancer: An Italian biopsy color analysis. Eur J Surg Oncol 37: 1025-1029.
- Fowke JH, Motley SS, Concepcion RS (2012) Obesity, body composition, and prostate cancer. BMC Cancer 12: 23-30.
- Thompson JM, Goodman PJ, Tangen CM (2003) The influence of finasteride on the development of prostate cancer. N Engl J Med 349: 215-224.
- Pruthi RS, Swords K, Schultz H (2009) The impact of obesity on the diagnosis of prostate cancer using a modern estended biopsy scheme. J Urol 181: 574-577.
- Gallina A, Karakiewicz PI, Hutterer GC (2007) Obesity does not predispose to more aggressive prostate cancer either at biopsy or radical prostatectomy in European men. Inter J Cancer 121: 791-795.
- Chun FK, Briganti A, Graefen M (2007) Body mass index does not improve the ability to predict biochemical recurrence after radical prostatectomy. Eur J Cancer 43: 375-382.
- Prehn RT (1999) On the prevention and therapy of prostate cancer by androgen administration. Cancer Res 59: 4161-4164.
- Corona G1, Rastrelli G, Morelli A (2011) Hypogonadism and metabolic syndrome. J Endocrinol Invest. 34: 557-567.
- Tirabassi G, Gioia A, Giovannini L (2013)Testosterone and cardiovascular risk. Intern Emerg Med 8 Suppl 1: S65-S69


Table 1:
Characteristics of the samples. Data are expressed as medians (quartiles) (continous variable) as percentages (categorical variables). BMI= Body Mass Index; PSA=Prostatic Specific Antigen; BGS=Gleason Score Biopsy; POGS=Postoperative Gleason Score.
Table 1: Characteristics of the samples. Data are expressed as medians (quartiles) (continous variable) as percentages (categorical variables). BMI= Body Mass Index; PSA=Prostatic Specific Antigen; BGS=Gleason Score Biopsy; POGS=Postoperative Gleason Score.