Authors:
Amlendu Prabhakar1#, Ashley Quach1#, Di Wang1, Haojiong Zhang1, Mirna Terrera1, David Jackemeyer1, Xiaojun Xian1, Francis Tsow1, Nongjian Tao1,3 and Erica S Forzani2*#
1Center for Bioelectronics and Biosensors, the Biodesign Institute, Arizona State University, USA
2School for Engineering of Matter, Transport, and Energy, Arizona State University, USA
3School of Electrical, Computer, and Energy Engineering, Arizona State University, USA
#Authors contributed equally
Received: 17 September, 2014; Accepted: 13 October, 2014; Published: 15 October, 2014
Erica Forzani, Center for Bioelectronics and Biosensors, The Biodesign Institute at Arizona State University, 1001 S McAllister Ave, Tempe, AZ 85287, USA, Email:
Prabhakar A, Quach A, Wang D, Zhang H, Terrera M, et al. (2014) Breath Acetone as Biomarker for Lipid Oxidation and Early Ketone Detection. Glob J Obes Diabetes Metab Syndr 1(1): 012-019. DOI: 10.17352/2455-8583.000003
© 2014 Prabhakar A, et al. This is an open-access article distributed under the terms of the Creative Commons Attribution License, which permits unrestricted use, distribution, and reproduction in any medium, provided the original author and source are credited.
Ketonic diet; Acetone; Ketone; Fasting ketosis; Nutritional ketosis; Starvation
Former ketone studies, including ketoacidosis (KAD), fasting ketosis (FK), nutritional ketosis (NK), and exercis-eaffected ketosis have brought great advances to the field of ketones. In the present work, blood, urine and breath ketone detections were evaluated systematically. We found that breath ketone (acetone) is the ketone of choice for detecting early stages of ketosis. In addition, acetone was correlated with respiratory quotient, and found to be a highly sensitive non-invasive biomarker of lipid oxidation. Furthermore, acetone was used for fast screening of ketosis or ketoacidosis in populations, and demonstrated value upon screening a population of 48 individuals, among which a type I diabetes case with early symptoms of KAD and FK case were identified.
Introduction
Ketosis or ketoacidosis is a physiological state in which fat metabolism rate is increased due to the lack of glucose as energy source, and ketone bodies’ levels are above normal levels [1]. As fat is oxidized, ketones are produced, and monitoring ketones has a profound impact on the diagnosis of health status of an individual either under ketoacidosis or ketosis.
Ketoacidocis (KAD) is a state of diagnosis of metabolic unbalance in type I diabetic population, and indicative of diabetic coma risk [2]. On the contrary, ketosis is a metabolic state where ketone is produced in healthy individuals by fasting or nutritional intervention [3,4]. Fasting ketosis (FK) is produced by oxidation of stored fat induced by negative energy balance (caloric restriction). Nutritional ketosis (NK) is found in individuals undergoing fat-rich diets with null energy balance (caloric intake equals energy expenditure).
Recently, NK has become popular [5] for weight loss therapy [6], and for treating certain type of epilepsy where ketones can be used as energy source by the brain to reduce epileptic seizures [7,8]. Ketosis can also be induced in a healthy individual via exercise as the body uses ketones as energy source in the muscles [9,10]. In general, the ketone level in a body is affected by several factors, such as diabetes, energy balance, diet composition, and physical activities, which underscores the significance of identifying best practices of detection of ketones in real time.
Under ketosis or ketoacidosis, fat is broken down by the liver to produce two water-soluble types of ketones: acetoacetic acid and beta-hydroxybutyric acid (Figure 1). In addition, a third type of ketone, acetone, is also formed with additional enzymatic decarboxylation of acetoacetic acid. Acetone crosses the membrane barrier, into the alveoli of the lung and the airway due to its high vapor pressure, and it is usually found in breath. Currently, there are different ketone detecting methods, which are aimed to detect each of the three types of ketones. Each of the method has advantages and disadvantages [11], but a comparison of the methods under rigorous clinical conditions is necessary to define which method has the highest sensitivity to detect increasing ketone levels or define ketosis/ketoacidosis states. Blood and urinary ketone detections have been widely used for diagnosis of KAD. However, blood ketone detection is considered invasive and painful while urinary ketone detection can be impaired by subject’s level of hydration, adaptation to ketosis states or kidney dysfunction [11]. Most recently, breath acetone has been considered as a new ketone biomarker because it is non-invasive, convenient, and accurate reflection of the body’s ketone level [12]. Several acetone detection products are commercially available such as KetoSense and Ketonix [13,14] or emerging to the market such as NTT Docomo acetone monitor [15], Medamonitor [16] and Invoy Technologies [17]. These emerging technologies are still under evaluation for analytical and clinical accuracy. Currently the proven technology for accurate detection of ketone levels in breath are mass spectrometer-based methods [18,19].
In this study, we used Selected Ion Flow Tube-Mass Spectrometry (SIFT-MS) as a primary method for detection of breath ketone, acetone, and we compare the results with those obtained with the widely used blood and urine ketone detection methods. Blood ketone was quantified using ketone strips and Precision Xtra meter, which have proven to be highly accurate [20,21], and urinary ketone was measured using Ketostix strips, which has been recommended by the American Diabetes Association for monitoring ketones in urine [22].
We hypothesize that detecting ketone from breath (acetone) is the most sensitive method for early detection of ketosis or ketoacidosis; and levels of produced breath acetone reflect rates of lipid oxidation accurately. To validate our hypothesis, we evaluated different ketone assessment methods, and determined the most sensitive and selective way method to quantify ketosis. We also compared the ketone levels to the measured respiratory quotient (RQ), a reference biomarker of lipid oxidation. To determine whether breath ketone detection is valuable for diagnosis of ketosis or ketoacidosis, we collected real-time breath acetone from 48 subjects and analyzed the outcomes.
Material and Methods
Ketone assessment methods
Three common methods were utilized:
A-Blood ketone measurements: Blood ketones were measured using Precision Xtra, an lectrochemical capillary blood monitor from Abbott. This monitor determines the blood ketone: beta-hydroxybutyrate (β-OHB). Standard operation procedures as prescribed by the monitor were used for the analysis. The test meter was turned on while a ketone strip was inserted to prepare for the test. The subjects’ fingertip was cleaned with an alcohol swab and dried before being pricked with the provided lancing device. A drop of blood was applied to the assigned spot of the ketone strip. Ketone levels were read from the display 10 seconds after blood was delivered to the meter.
B-Urine ketone measurements: Urine ketone measurements were performed using over-the-counter reagent strips for urinalysis (Ketostix from Bayers). The strip monitors acetoacetic acid (AcAcA), which reacts with nitroprusside salt. The reagent end of strip was passed through urine stream, which resulted in color development on the strip. The color was compared to the color chart provided with the product 15-30 seconds after the reaction.
C-Breath ketone measurements: Concentration of breath ketone, acetone, was assessed from exhaled breath using Selected Ion Flow Tube - Mass Spectrometer (SIFT-MS) (Instrument Science, Profile Series, Crewe, UK [23]) in multiple ion monitoring (MIM) modes. H3O+ (m/z 19) was chosen as the precursor ion for reaction with breath samples in ultra-high purity 99.999% He as the carrier gas. Precursor ion peaks at m/z 19, 37, 55, and 73 corresponding to hydrated H3O+.nH2O (n = 0, 1, 2, 3) and product ion peaks after reaction with acetone at m/z 59 and 77, corresponding to C3H7O+ and its hydrate C3H7O+.H2O, were monitored. Quantification of the concentration was performed in the MIM mode by taking into account the known reaction rate coefficients for H3O+ and acetone reaction, and the measured ion flow velocity [18]. Subjects’ breath was collected in a 4L-air bag and followed by immediate analysis by SIFT-MS. A small pump was used to ensure constant flow. Each measurement took about 30 seconds.
Respiratory Quotient measurements
In order to determine the correlation of breath ketone (acetone) with lipid oxidation, non-protein respiratory quotient (RQ), which indicates the percentage of lipid oxidation vs. carbohydrate oxidation [24] was assessed. The measurement was performed on subjects of the study (see conditions below), using both, Oxycon Mobile metabolic portable instrument (Carefusion, Yorba Linda, CA [25]), and a mobile Breezing metabolism tracker (prototype of professional version) (Breezing Co., Tempe, AZ [26]). The RQ values were obtained consecutively to acetone measurements (using SIFT-MS).
Glucose measurements
In addition to ketone analysis, blood glucose was measured for comparison using Precision Xtra, electrochemical capillary blood monitor from Abbott, and glucose strips, according to the standard procedure as prescribed by the vendor. All ketones and blood glucose measurements were carried out simultaneously for direct comparison.
Subjects
Two types of experiments were performed with subjects involved in the donation of samples.
Subjects in diet-fasting group
Eleven healthy volunteers (7 males and 4 females) with an average age of 27 ± 7 years and average BMI of 23.1 ± 5 participated in the diet-fasting study (see conditions below). Physical parameters of weight, height, and BMI (a ratio of weight-to-height squared (Kg/(meters)2)) were assessed for each subject. Table 1 summarizes the features of the study group.
None of the subjects was on regular medication, nor had any history of respiratory diseases nor diabetes. The diet-fasting experiment consisted of two days. On day 1, isocaloric meals with different fat contents were given to each subject, who had the last meal between 9:00 pm and 10:00 pm at the previous night. On day 2, the subjects fasted until 7:00 pm with breath samples collected and measured from 10:00 am with a time interval of 90 to 120 minutes for 9 hours. Meanwhile, blood and urine ketones from each subject were measured. In most of the subjects, blood and urine measurements were performed 3 times a day (start, mid, and end of the day) in conjunction with a breath ketone measurement. Urine and blood measurements were performed 3 times only since these ketone detection methods showed lower sensitivity to rising ketone levels when compared to breath ketone detection method. Several subjects from the group had blood, urine, and breath ketones measured in parallel, 6-8 times a day, during the fasting day (Day 2). In addition, a group of the study subjects was also measured on Day 1, while having a fat-rich diet (see more details below).
It is important to mention that all subjects remained sedentary during the fasting day (Day 2). This condition was essential to minimized perturbations of ketone fasting patterns due to exercise. All subjects complied the study’s IRB protocol approved at Arizona State University.
Breath acetone measurements for ketone screening
Breath acetone samples of 48 random subjects visiting an exhibition event at Biodesign Institute on March 1st, 2014 [27] were collected. The age of the subjects ranged from 4 to 55. Subject’s breath was collected in a 4L-air bag and followed by immediate analysis with SIFT-MS. A small pump was used to ensure a constant flow during sample collection. Each measurement took approximately 30 seconds.
Results
Evaluation of ketone assessment methods
Different ketone detection methods were compared to determine the best strategy to capture accurate and high-resolution ketone buildup data. First, the relationship between breath ketone (acetone) and blood ketone (β-OHB) was studied in the group of fasting subjects (Day 2 of diet-fasting group). Figure 2A shows the correlation that emerged from the data. The correlation can be fitted with an exponential growth function with a squared-regression coefficient (R2)=0.69, which is in agreement with the literature for adults and children’ ketogenic dieters [19,28]. Second, the relationship between breath ketone (acetone), and urinary ketone (AcAcA) was studied in the same fasting subject group. Figure 2B shows the correlation with an exponential fitting with R2=0.81. In addition, Figure 3 shows the ketone profiles assessed in breath, urine, and blood in an individual over the period corresponding to the fasting day (Day 2, more details in discussion section).
Evaluation of breath ketone as biomarker of lipid oxidation
The correlation between breath ketone levels and lipid oxidation was studied to ensure that the acetone level buildup is associated with increased oxidation of lipids. For this purpose, RQ [29,30] was measured in parallel to acetone. RQ and acetone measurements were performed for 9 subjects of the diet-fasting group on the fasting day (Day 2). RQ was calculated by measuring the ratio of VCO2 to VO2, where VCO2 is the carbon dioxide production rate, and VO2 is the oxygen consumption rate, assessed by indirect calorimetry measures as described in Experimental Session. Figure 4A shows an example of dynamic changes of acetone levels and RQ for an individual during the fasting day. Similar results were obtained for the remaining subjects. The results are summarized in Figure 4B, which shows a plot of RQ vs. acetone levels with exponential correlation and R2=0.41. The results indicated the value of acetone as a biomarker of fat oxidation. However, in order to further assure this fact, RQ vs. acetone level was also investigated in a separate set of experiments where the subjects changed their diet composition throughout the day (Day 1 of diet-fasting group).
As an example, Figure 5 shows one of the study subjects, who changed the diet macronutrient content from 4.5:1 of fat:(carbohydrate + protein) with [82% fat, 9% protein, and 9% carbohydrate] to 3.0:1 of fat:(carbohydrate + protein) with [75% fat, 16% protein, and 9% carbohydrate]. The decreasing ingestion of fat (by changing diet), which is expected to lead to lesser oxidation of fat, was correlated to an increase in RQ values (in agreement with lesser fat oxidation) [29,30], and a decrease in the rate of acetone level increase (see more details in discussion section).
Since ketones have been studied as a marker for blood glucose [31,32], breath acetone and blood glucose on the fasting day (Day 2) have been simultaneously measured for the diet-fasting group. Figure 6 shows the results, which can be fitted with an exponentially decaying curve with R2=0.52 (more details in discussion section).
Breath acetone measurements for ketone screening
Breath samples from 48 subjects were collected from an exhibition event as described in the experimental section. Two thirds of the subjects were younger than 15 years old with a nearly equal distribution of male and female (Figure 7B). The acetone levels of the samples were found to be between 300 to 1000 ppbV (Figure 7A). However, several subjects had higher acetone levels (more details in discussion section).
Discussion
Evaluation of ketone assessment methods
Figure 2B, illustrated urinary ketone as a “step-function” behavior due to the qualitative nature of the test. However, as shown in Figure 2, a strong correlation was evident between acetone (breath) and β-OHB (blood) as well as between acetone (breath) and AcAcA (urine) for the subjects under fasting conditions. The behavior has been observed before for acetone and β-OHB in subjects under ketogenic diets [19,28]. There are many hypotheses to explain the relationship. First, acetone is a metabolite produced after enzymatic decarboxylation of AcAcA, which is in equilibrium with β-OHB via an enzymatic controlled process by β-OHB dehydrogenase [34]. The enzymatic controlled metabolic pathways may produce a non-linear relationship between acetone and β-OHB (blood), and AcAcA (urine) (Figure 1). Another hypothesis for the observed non-linear relationship between acetone and β-OHB or AcAcA is that acetone is a highly volatile organic compound, and therefore its blood/breath partition behavior is favored towards the breath phase. In fact, it is well known that acetone presents positive deviations from well-known gas/liquid partition laws, such as Henry’s law or Raoul’s law [34]. Although exponential relationship between acetone and β-OHB, and acetone and AcAcA was observed, acetone reflected overall ketone metabolite concentrations in the subjects under fasting conditions.
-
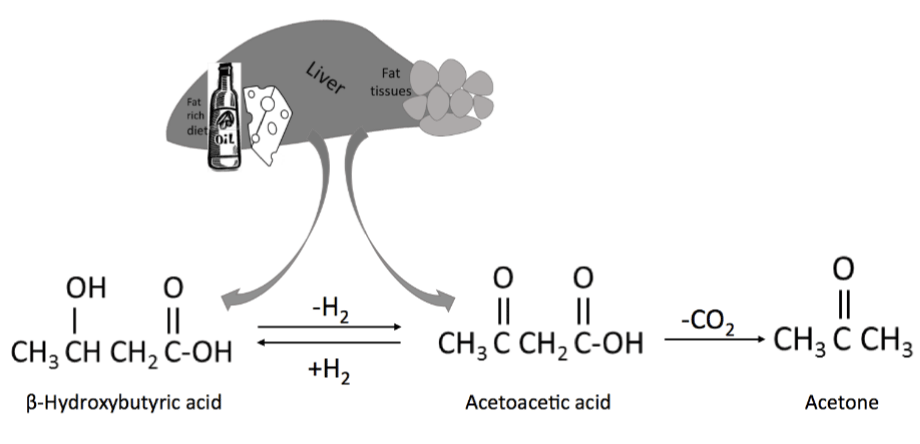
Figure 1:
Liver breaks down fat from food and/or fat cells to produce three ketone bodies.
-
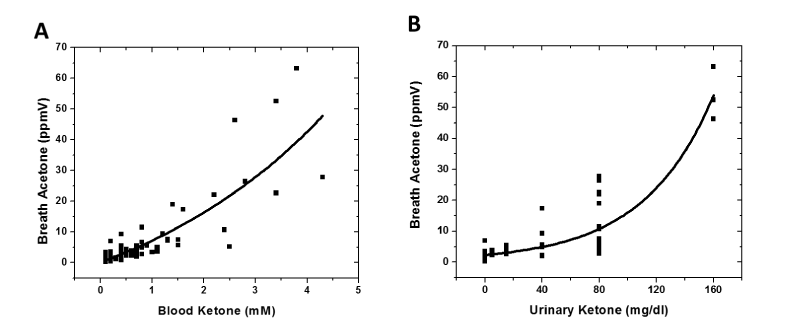
Figure 2:
Correlations between breath acetone (measured using SIFT-MS) vs. blood ketone levels (measured using a capillary blood monitor) (A), and vs. urinary ketone levels (measured using dipsticks) (B). The data was exponentially correlated with R2 of 0.69 (A) and 0.81 (B), respectively.
Figure 3 shows an example of experiments where blood (β-OHB), urine (AcAcA) and breath (acetone) ketone levels were assessed simultaneously during the fasting day (Day 2) in a subject from the diet-fasting group. The ketone values are compared after normalization of the values by the maximum response assessed for each method. It can be observed that urine analysis showed a delayed response and stayed constant after the initial significant increase. On the other hand, blood analysis showed a steady increase of β-OHB during the day. However, given the minimum resolution of 0.1 mM of the β-OHB sensor for blood, null values for β-OHB were assessed at testing events #1 and #2, where the overall ketones in the body were low, but building up due to the fasting state. On the contrary, acetone (breath) reflected the fasting state of the subjects with higher sensitivity, and followed the changing clinical condition of the tested individuals more dynamically. Therefore, acetone provided higher resolution to ketone buildup capability during fasting; and was chosen as ketone biomarker of choice for the screening of ketosis.
-
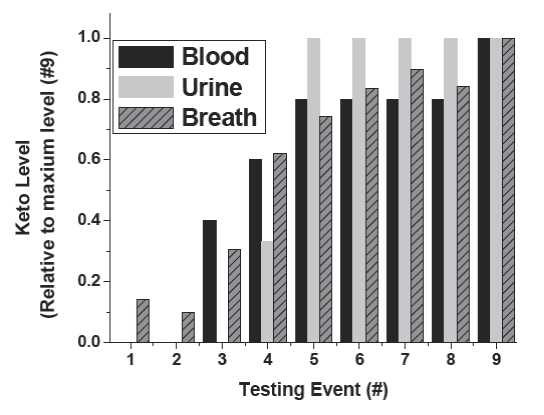
Figure 3:
Comparison of urine, blood, and breath ketone measurements. Simultaneous measurements were performed using standard commercial equipment, SIFT-MS for breath acetone, capillary blood monitor for blood glucose, and dipsticks for urinary ketones (see experimental section). The ketone levels (keto level) were normalized by the highest ketone level measured within the corresponding method.
Several reasons support breath acetone as a ketone biomarker of choice: (1) Analytical sensitivity: The analytical method used for detection of acetone, SIFT-MS, is the most sensitive and selective method among other methods. The method is real-time, provides hundred part-per-billion by volume (ppbV) detection levels, reports absolute acetone concentrations based on unambiguous ionized gas detection principle, and does not require complex preparation procedures [35-38]. (2) Clinical sensitivity: Among the three ketone molecules, acetone is the one with the highest vapor pressure. Consequently, it is easiest to be released from the body, especially to the headspace of lung alveolar areas [39]. (3) Friendly sample collection: Breath acetone monitoring is non-invasive and easy to perform for the users [39].
Evaluation of breath ketone as biomarker of lipid oxidation
In Figure 4A, decreasing RQ values from ~0.85 to ~0.70 were associated to increasing acetone levels. The RQ values indicated a switch from both 50% fat oxidation/50% carbohydrate oxidation to 100% fat oxidation, and therefore, were indicative of a greater reliance on lipid utilization as carbohydrate became unavailable with hours of fasting [40,41]. Additional evidence of the strong correlation between acetone and lipid oxidation (RQ) from 9 subjects of the diet-fasting group during a fasting day (Day 2) is illustrated in Figure 4B.
-
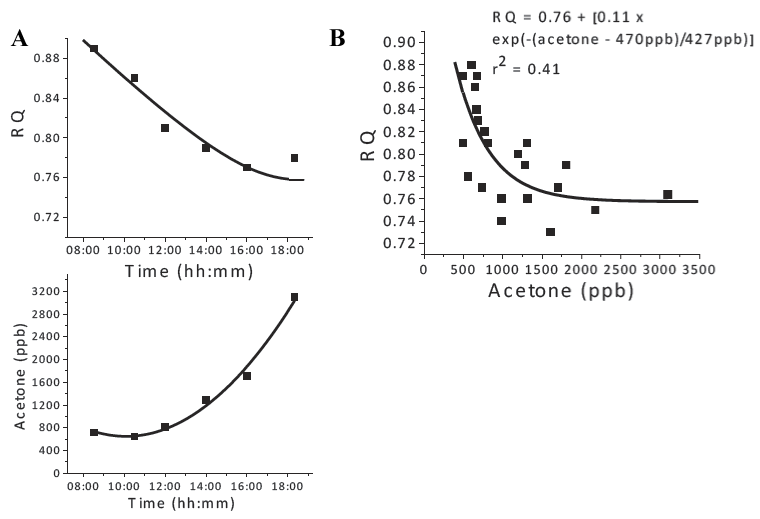
Figure 4:
(A) RQ and acetone vs. time during a ketosis induction period for a representative study subject. (B) RQ vs. acetone plot from RQ and acetone profiles assessed from 9 out of the 11 subjects of the study during the fasting day (Day 2).
Figure 5 shows as example of the effect of a diet change on RQ and acetone values measured during Day 1 of the diet-fasting experiment. In this case, the diet had high fat ratio, and it was changed from 82% fat:18% (carb+protein) to 75% fat:25% (carb+ protein) at 3:45 pm. At higher dietary fat ratio, the lipid utilization increase from 52% (RQ=0.84) to 100% (RQ~0.70) after 4 hours 45 minutes, while at lower dietary fat ratio, the lipid utilization decreased from 100% (RQ~0.70) to 87% (RQ~0.74) after 4 hours. In parallel, the rate of acetone level increase changed from 0.30 ppm/hour at higher dietary fat ratio to 0.04 ppm/hour at lower dietary fat ratio. This behavior indicated a decrease in the rate of rising acetone levels associated to a decrease of lipid utilization, and it was in agreement with observations collected on other subjects of the group. Although the acetone level itself is not a fast indicator of switching of energy source, the rising of acetone level is.
-
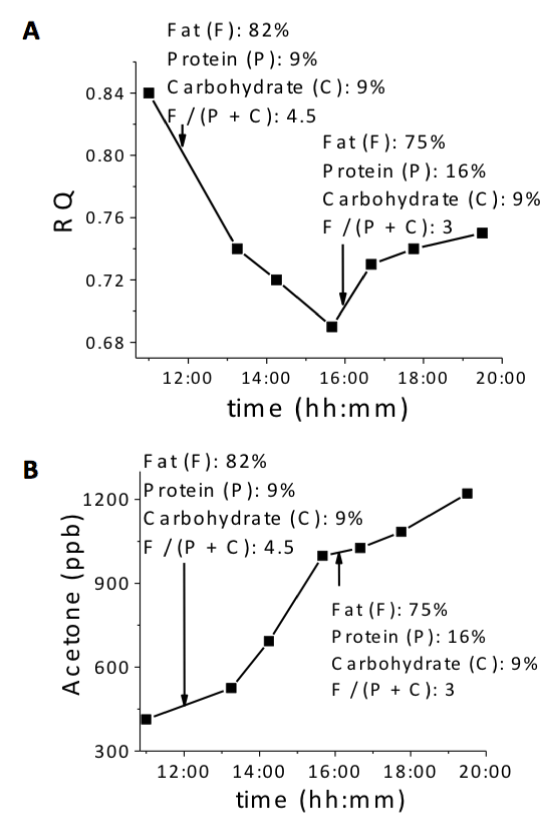
Figure 5:
Changes of RQ (A) and acetone levels (B) with the changes of diet during a day.
The above results confirmed breath acetone as a biomarker of fat oxidation, and overall, a convenient biomarker for non-invasive monitoring. To better understand the correlation between acetone and glucose levels during fasting periods, we examined simultaneously breath acetone and blood glucose in the diet/fasting group during the fasting day (Day 2). The data is summarized in Figure 6, which confirmed the published literature data [31,32], indicating an overall trend of acetone increase when glucose levels decreased. However, it is important to mention that glucose and acetone are biomarkers reflective of different energy source pathways. While acetone levels are indicative of fat oxidation, glucose levels are indicative of carbohydrate metabolism. Monitoring each metabolic route may provide independent information about the individual’s metabolic regulations that depend on specific glycogen storage, insulin resistance, and other important physiological parameters [5]. Therefore, acetone should be considered as a non-invasive method that offers complementary value to invasive glucose measurement for the evaluation of metabolic regulation.
-
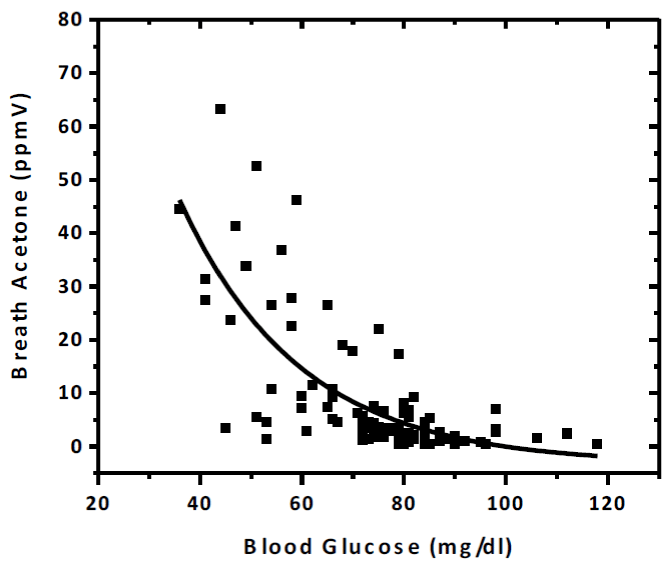
Figure 6:
Correlation of breath acetone levels with blood glucose collected from different subjects on their fasting days. The data was fitted to an exponentially decaying curve: y = ae-x/b+c. Parameters a, b, and c were 228234 ± 100652, 23.56 ± 6.52, and -3277.11 ± 4184.95 respectively. The squared regression coefficient (R2) was 0.52.
Breath acetone measurements for ketone screening
Figure 7 shows the results collected from 48 random subjects at an event, and indicates that most of general public had acetone levels between 300 to 1000 ppbV. Few subjects had acetone levels higher than 1000 ppbV but lower than 1500 ppbV. Only two subjects had acetone levels higher than 1500 ppbV. One of the subjects was a child who was later diagnosed with type 1-diabetes by following standard-of-care procedure. The second subject was an adult with acetone level higher than 2500 ppbV and reported to be fasting. This study reassures that breath acetone can be used for ketosis/ketoacidosis screening.
-
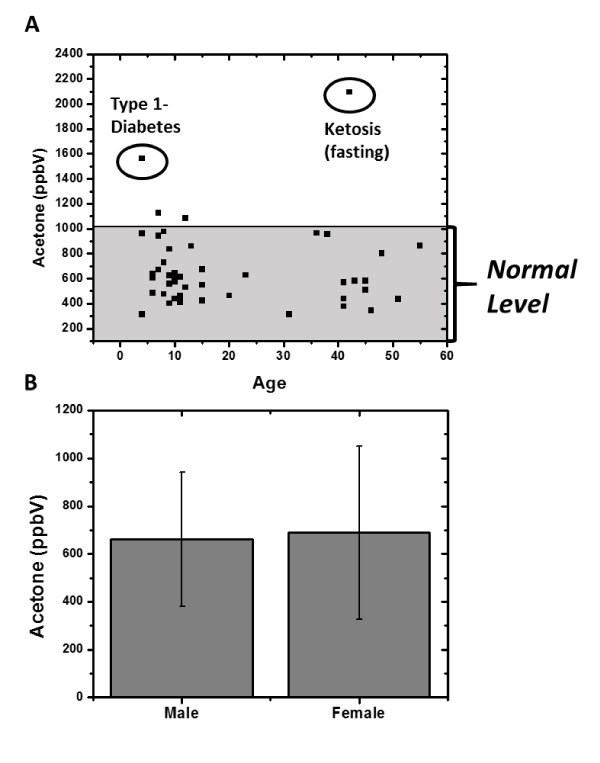
Figure 7:
Screening of breath acetone levels of 48 random subjects. (A) A child with type 1- diabetes and an adult under fasting state were confirmed after the breath acetone screening event. Their acetone levels are higher compared to the normal level of the general population (from 300 to 1000ppbV). (B) Acetone averaged levels and standard deviation for male and female group of the population.
Conclusions
Breath acetone measured by SIFT-MS is more sensitive than blood ketone measured by capillary blood monitors and urine ketone measured by dipsticks, and it is the biomarker of choice when detected with a resolution of few part-per-billion by volume. Breath acetone is a convenient way to detect ketones due to the non-invasive nature of the method. In addition to the convenience of sampling, breath acetone also provides analytical advantage because it is easier to release from the body compared to other blood ketones that are soluble in blood and urine. Furthermore, the data presented in this study confirmed breath acetone as a biomarker for monitoring lipid oxidation, and demonstrated the advantages for ketosis and ketoacidosis screenings.
Acknowledgments
We would like to acknowledge full compliances from all eleven subjects of the diet study, which followed Arizona State University’s approved IRB protocol, and financial assistance from School for Engineering of Matter, Transport, and Energy, Arizona State University.
Author contributions
Amlendu Prabhakar, Ashley Quach, Di Wang (study, experimental), David Jackemeyer and Mirna Terrera (discussion on understanding of ketosis, subject recruitment), Haojiong Zhang (RQ/acetone data), Francis Tsow (SIFT support), Xiaojun Xian (miscellaneous support), Erica Forzani (design of study, diet management, logistics (IRB), discussion), Nongjian Tao (support, and discussion).
-
-
- Veech RL, Chance B, Kashiwaya Y, Lardy HA, Cahill GF (2001) Ketone bodies, potential therapeutic uses. IUBMB life 51: 241-247.
- Charles R, Bee Y, Eng P, Goh S (2007) Point-of-care blood ketone testing screening for diabetic ketoacidosis at the emergency department. Singapore Med J 48: 986-989.
- Vining EP (2002) The ketogenic diet. Intractable Seizures Springer 497: 225-231.
- Garrow JS (1974) Energy balance and obesity in man North-Holland Publishing Company. 335pp.
- Frayn K (2010) Metabolic Regulation A Human Perspective. (3rd Edition). Wiley-Blackwell.
- Brehm BJ, Seeley RJ, Daniels SR, D’Alessio DA (2003) A randomized trial comparing a very low carbohydrate diet and a alorie-restricted low fat diet on body weight and cardiovascular risk factors in healthy women. J Clin Endocrinol Metab 88: 1617-1623.
- Keene DL (2006) A systematic review of the use of the ketogenic diet in childhood epilepsy. Pediatr Neurol 35: 1-5.
- Mitchell GA, Kassovska-Bratinova S, Boukaftane Y, Robert MF, Wang SP, et al. (1995) Medical aspects of ketone body metabolism. Clin Invest Med 18: 193-216.
- Koeslag J (1982) Post-exercise ketosis and the hormone response. Med Sci Sports Exerc 14: 327-334.
- Sasaki H, Ishikawa S, Ueda H, KIMURA Y (2011) Response of Acetone in Expired Air During Graded and Prolonged xercise. Advances in exercise and sports physiology 16: 97-100.
- Moore J, Westman EC (2014) Keto Clarity: Vistory Belt Publishing Inc.
- Qiao Y, Gao Z, Liu Y, Cheng Y, Yu M, et al. (2014) Breath Ketone Testing: A New Biomarker for Diagnosis and Therapeutic Monitoring of Diabetic Ketosis. Biomed Res Int 2014: 869186.
- Clarholm J (2013) Ketosense – An Arduino based ketosis detector.
- The worlds first reusable breath ketone analyzer! (2014) https://www.ketonix.com/
- Toyooka T, Hiyama S, Yamada Y (2013) A prototype portable breath acetone analyzer for monitoring fat loss. J Breath Res 7: 036005.
- Medamonitor Now You Know (2014) http://www.medamonitor.com/
- Invoy Technologies LLC. Invoy Technologies LLC: (2013) http://www.invoy.com/technology.php
- Smith D, Wang T, Španĕl P (2003) Analysis of ketones by selected ion flow tube mass spectrometry. Rapid Commun Mass Spectrom 17: 2655-2660.
- Musa-Veloso K, Likhodii SS, Cunnane SC (2002) Breath acetone is a reliable indicator of ketosis in adults consuming ketogenic meals. Am J Clin Nutr 76: 65-70.
- Wallace TM, Meston NM, Gardner SG, Matthews DR (2001) The hospital and home use of a 30-second hand- held blood ketone meter: guidelines for clinical practice. Diabetic Medicine 18: 640-645.
- Byrne H, Tieszen K, Hollis S, Dornan T, New J (2000) Evaluation of an electrochemical sensor for measuring blood ketones. Diabetes Care 23: 500-503.
- American Diabetes Association. (2013) www.diabetes.org,
- Instrument Science. www.instrumentscience.com
- McArdle WD, Katch FI, Katch VL (2010) Exercise physiology: nutrition, energy, and human performance: Lippincott Williams & Wilkins,
- CareFusion. (2014) www.carefusion.com,2014
- Breezing. (2014) www.breeezing.com,
- Science Unlocked: Night of the Open Door at the Biodesign Institute. http://www.biodesign.asu.edu/calendar/science-unlocked-night-of-the-open-door-at-the-biodesign-institute, 2014.
- Musa-Veloso K, Likhodii SS, Rarama E, Benoit S, Liu YM, et al. (2006) Breath acetone predicts plasma ketone bodies in children with pilepsy on a ketogenic diet. Nutrition 22: 1-8.
- Flatt JP (1995) Body-Composition, Respiratory Quotient, and Weight Maintenance. Am J Clin Nutr 62: S1107-S1117.
- Westerterp KR (1993) Food Quotient, Respiratory Quotient, and Energy-Balance. Am J Clin Nutr 57: S759-S765.
- Wang C, Mbi A, Shepherd M (2010) A study on breath acetone in diabetic patients using a cavity ringdown breath analyzer: exploring correlations of breath acetone with blood glucose and glycohemoglobin A1C. Sensors Journal, IEEE 10: 54-63.
- Galassetti PR, Novak B, Nemet D, Rose-Gottron C, Cooper DM, et al. (2005) Breath ethanol and acetone as indicators of serum glucose levels: an initial report. Diabetes Technol Ther 7: 115-123.
- Cahill Jr GF, Veech RL (2003) Ketoacids? Good medicine? Trans Am Clin Climatol Assoc 114: 149-161.
- Atkins P, Paula DJ (1986) PhysicalChemistry, 3rd ed. Great Britian: Oxford Univeristy Press.
- Smith D, Spanel P (2007) The challenge of breath analysis for clinical diagnosis and therapeutic monitoring. Analyst 132: 390-396.
- Smith D, Spanel P, Davies S (1999) Trace gases in breath of healthy volunteers when fasting and after a protein- calorie meal: a preliminary study. J Appl Physiol 87: 1584-1588.
- Smith D, Španěl P, Fryer AA, Hanna F, Ferns GA (2011) Can volatile compounds in exhaled breath be used to monitor control in diabetes mellitus? J Breath Res 5: 022001.
- Spanel P, Smith D (2011) Progress in SIFT-MS: breath analysis and other applications. Mass Spectrom Rev 30: 236-267.
- Kundu SK, Bruzek JA, Nair R, Judilla AM (1993) Breath acetone analyzer: diagnostic tool to monitor dietary fat loss. Clin Chem 39: 87-92.
- Bosy-Westphal A, Kossel E, Goele K, Later W, Hitze B, et al. (2009) Contribution of individual organ mass loss to weight loss-associated decline in resting energy expenditure. Am J Clin Nutr 90: 993-1001.
- Kaplan LA, Pesce AJ (1984) Clinical Chemsitry: theory, analysis, and correlation. Mosby, Co, St Louis, Toronto, Princeton.
-
-
-
-


Table 1:
Summary of subjects enrolled in the study.
M: Male, F: Female, BMI: Body Mass Index
Table 1: Summary of subjects enrolled in the study.
M: Male, F: Female, BMI: Body Mass Index