


Authors:
Valmore Bermúdez1*, Joselyn Rojas1, Juan Salazar1, Robys Gonzalez1, Maria Sofía Martinez1, Carmen Chavez1, Marcos Palacio2,3, Edward Rojas1, Mayela Cabrera1 and Jose Lopez Miranda4
1Endocrine and Metabolic Diseases Research Center, School of Medicine, The University of Zulia, Maracaibo, Zulia - Venezuela
2Fellow of the Advanced Endocrinology Master Program. Alcalá de Henares University. Madrid, Spain
3Medicine Department, IVSS "Dr. Pedro García Clara" Hospital. Ciudad Ojeda, Zulia - Venezuela
4Lipid and Atherosclerosis Unit, Department of Medicine. IMIBIC/Reina Sofia University Hospital/University of Cordoba, and CIBER Fisiopatología Obesidad y Nutrición (CIBEROBN), Instituto de Salud Carlos III, Spain
Received: 17 September, 2014; Accepted: 22 October, 2014; Published: 24 October, 2014
Valmore J. Bermúdez, MD, MSc, MPH, PhD, The University of Zulia, Endocrine and Metabolic Diseases Research Center, 20th Avenue, Maracaibo 4004, Venezuela, Tel/Fax: 58-261-7597279; Email:
Bermudez V, Rojas J, Salazar J, Gonzalez R, Martinez MS, et al. (2014) Coronary Risk Estimation according to the Framingham-Wilson Score and Impaired Fasting Glucose in Adult Subjects from Maracaibo city, Venezuela. Glob J Obes Diabetes Metab Syndr 1(1): 020-029. DOI: 10.17352/2455-8583.000004
© 2014 Bermúdez V, et al. This is an open-access article distributed under the terms of the Creative Commons Attribution License, which permits unrestricted use, distribution, and reproduction in any medium, provided the original author and source are credited.
Impaired fasting glucose; Coronary risk; Framingham-Wilson equation; Prediabetes; Type 2 Diabetes Mellitus
Introduction: Type 2 Diabetes Mellitus (T2DM) is an independent risk factor for coronary artery disease. Nevertheless, the coronary risk rendered by pre-diabetes states such as Impaired Fasting Glucose (IFG) has not been thoroughly explored. The purpose of this study was to evaluate the influence of glycemic status on coronary risk estimated by the recalibrated Framingham-Wilson equation in our population.
Materials and Methods: A total 1,378 of subjects were selected from the Maracaibo City Metabolic Syndrome Prevalence Study. A complete medical history was taken, next to laboratory workup and anthropometric measurement. All subjects were classified according to glycemic status in normal fasting glucose (NG), impaired fasting glucose (IFG), and T2DM. Coronary risk estimation was calculated using the Framingham-Wilson equation recalibrated for our population.
Results: An increase in coronary risk was observed in IFG (p=3.78x10⁻⁶) and DM (p=4.34x10⁻¹³) when compared to NG; pattern also observed within genders: men (p=1.57x10⁻⁴) and women (p=2.37x10⁻⁴). Coronary risk also increased according to age in all categories of glycemic status. Within the IFG group, occupational status (p=0.004), smoking (p=2.29x10⁻⁵) and alcohol consumption (p=0.013) were associated with higher coronary risk. Finally, subjects with IFG exhibited greater probability for allocation in high coronary risk categories [OR: 1.46 (1.06 - 2.14); p=0.05].
Conclusions: Coronary risk scores from the recalibrated Framingham-Wilson equation were significantly higher in subjects with IFG. In our population, this increase may be influenced by sociodemographic and psychobiological traits, such as marital and occupational status, smoking and alcohol consumption.
Introduction
Type 2 Diabetes Mellitus (T2DM) is one of the most prevalent diseases worldwide, with over 382 million people affected by the year 2013 [1], and a solemn prediction that by 2050, 1 out of every 5 adults will be diagnosed as diabetic [2]. In the United States, there are currently 25.8 million people with diabetes, 11,3% being over 20 years of age and 26.9% over the age of 65 [3]. There is also an increase in the annual cost of this disease, which has been calculated to be around 174 million dollars in the United States by 2013 [4]. The burden of this disease has also been observed in Venezuela, with 1.2 million patients by 2013, representing a prevalence of 6,61% [1].
The situation regarding prediabetes is a growing alarm because by 2010 a total of 79 million people in the United States were diagnosed [3], and it is estimated that by 2030, 472 million people worldwide will be diagnosed [5]. In our country, 1.5 million people had prediabetes by 2013, representing 8.25% of the general population [4]. The prediabetic state was first recognized in 1997 [6], encompassing two types of patients: those with impaired fasting glucose (IFG) and those with impaired glucose tolerance (IGT). Currently, this is diagnosed by either glucose measurement during fasting or after an oral glucose tolerance test (75 g) or the glycated hemoglobin percentage (HbA1c) determination [7]. It has been previously established that a prediabetic state precedes the development of full-blown glucose intolerance or diabetes mellitus [8], therefore prediabetes is a high-risk state [9], characterized by b-cell dysfunction and insulin resistance, even before hyperglycemia levels reach diabetic levels [8,9]. The risk of developing diabetes is 4-6% when compared with normoglycemic subjects [10], and year by year this risk increases by a factor of 10 [11].
Diabetes is a known important risk factor for cardiovascular disease [12], especially when considering that there is evidence of myocardial damage in recently diagnosed diabetic patients [13] and in those subjects with non-diabetic hyperglycemia [14], both related to microvascular dysfunction [14] and accelerated calcification of arterial vessels [15]. In a clinical study conducted by Selvin et al. [16], it was revealed that prediabetes and diabetes were associated with subclinical myocardial damage, with cumulative probabilities of elevated troponin T of 6.4% for prediabetes and 10.8% for diabetes patients. Even though prediabetes offers some degree of cardiovascular risk, the two clinical states (IFG and IGT) show different patterns on influence, being linear for IGT and “J-shaped” for IFG [17], both associated with higher cardiovascular associated morbidity and mortality [18,19].
Consequently, proper assessment of cardiovascular risk is a priority considering the elevated cardiovascular risk observed during the progression of hyperglycemic states towards diabetes. Several cardiovascular scores have been applied to determine cardiovascular risk in subjects with prediabetes and diabetes [20,21], and amongst them is the Framingham-Wilson Score [20,22]. Although this equation has been criticized due to its lack of applicability in populations such as Hispanics [23,24], we have recalibrated this formula to enhance its detection power in order to apply it in our locality [25,26]. In this context, estimation of coronary risk in patients with prediabetes or diabetes should be a basic tool in preventive epidemiology, especially in a population such as ours with high prevalence of obesity [27] and hyperlipoproteinemia (a) [28], and physical inactivity [29].
Therefore, the purpose of this study was to assess the epidemiologic behavior of coronary risk (using the Framingham-Wilson Equation) regarding classification of glycemic status, and the association between glycemic disturbances and risk stratification categories.
Materials and Methods
Population selection
The Maracaibo City Metabolic Syndrome Prevalence Study (MMSPS) was a cross-sectional study, with a randomized, multi-staged sampling methodology which has been published previously [30]. MMSPS enrolled 2,230 individuals, and for this branch of the study, the following exclusion criteria were applied: those under 30 or older than 74 years of age, and personal history of acute coronary syndrome. The final working sample was 1,378 subjects. After written consent was obtained, each individual was subjected to a complete physical examination and anamnesis, where information concerning ethnic group, occupational status, and educational status was obtained, while socioeconomic status was assessed through the Méndez-Castellano-modified Graffar´s scale [31].
Framingham-wilson equation calibration for maracaibo city
To calibrate the Framingham-Wilson equations [32], coefficients from the original formula were employed along with the major coronary event rate (lethal and non-lethal myocardial infarction and angor pectoris) obtained from the 2008 Zulia State Vital Statistics Yearbook [26]. From this data, risk was estimated with the following equation:
where S0(t) is the rate of individuals without coronary events; β iXi is the coefficient that results from the multiplication of each risk factor value by its β constant obtained from the Cox regression model from the Framingham study [32]; and β iXm is the coefficient rendered by the multiplication of the mean of each risk factor by its β constant, also obtained from the original Framingham study [32]. Afterwards, we calculate S0(t) in two steps using the following formulas [23,24,33,34]:
Step A: H0(t)/FramAll determination
where H0(t)/FramAll represents the rate of all types of coronary events - including silent Myocardial Infarction (MI) and angor pectoris, H0(t)/FramMajor is the rate of lethal and non-lethal symptomatic MI, and t is the time of follow-up, which in our case is 10 years. The coefficients 1.41 for men and 1.91 for women are risk variables obtained in the original Framingham study, and these proportions were assumed to be similar to our population. In this regard, based on local information, H0(t)/FramMajor can be substituted in the equation and H0(t)/FramAll calculated for each gender by resolving the equation as follows:
Obtaining the final results:
Step B: S0(t) determination
At this point, the rate of subjects without coronary events could be calculated through a subtraction, using H0(t)/FramAll values:
Once S0(t) determination was finalized, it was included in the original equation. Final results were classified in 4 categories: Low Risk (<5%), Moderate Risk (5-9.9%), High Risk (10-19.9%) and Very High Risk (≥20%) (32).
Blood pressure
Blood pressure was determined using the auscultatory method, with calibrated mercury sphygmomanometers, selecting Korotkoff`s phase I and V as systolic and diastolic blood pressures respectively. Blood pressure was taken with the subject sitting down, feet resting on the ground after a resting period of 15 minutes. The pressure was taken 3 times, with 15 minutes in between each take on two different days. Blood pressure was classified using the Seventh Joint National Committee on Prevention, Detection, Evaluation, and Treatment of High Blood Pressure (JNC-7) [35].
Anthropometry
An electrical bioelectric scale was used to obtain weight (Tanita, TBF-310 GS Body Composition Analyzer, Tokyo - Japan). Height was measured using a calibrated metric measurement tape, with the subject standing up barefoot. Body Mass Index (BMI) was calculated using the formula (weight/height2) expressed as kg/m2. Subjects were classified as normal weight, overweight, and obese according to the classification proposed by the WHO [36].
Clinical definitions
Diabetes and prediabetes: T2DM was diagnosed using one of the following criteria: 1) previous diagnosis of T2DM; 2) those without such previous diagnosis, but who over the course of this study were found to display fasting glucose levels ≥126 mg/dL in 2 different measurements [7]. Prediabetes was determined evaluating fasting glucose levels, considering IFG when it resulted between ≥100 and <126 mg/dL. Individuals with <100 mg/dL glucose levels were considered normoglycemic (NG). Known T2DM patients were considered to have satisfactory metabolic control when fasting glucose <130 mg/dL.
Smoking habit
Smokers were classified as follows [37]: a) Non-Smoker, any individual which has never tried a cigarette or has smoker less than 100 cigarettes in his life; b) Current Smoker, any individual which has smoked over 100 cigarettes in his life, or that refers to current habit, or that has quit smoking less than a year previous to this anamnesis; and c) Past Smoker, any individual that has consumed over 100 cigarettes in his life but has quit the habit over a year previous to this questioning.
Alcohol consumption
During anamnesis, individuals were asked how many drinks were consumed monthly. Those who consumed at least 1 drink per month were considered as Drinkers, and those who denied such habit were catalogued as Non-Drinkers [38]. Daily alcohol intake was calculated using the following formula [38].
where 0.8 is a constant representing ethanol density in drinks. Based on this quantification estimation, Drinkers were defined as subjects who consumed ≥1 gram of alcohol daily [38,39].
Laboratory analyses
Serum glucose levels were determined following 8-12 hours of fasting through the glucose oxidase technique using automated equipment (Human Gesellschoft Biochemica and Diagnostica MBH, Magdeburg, Germany). Likewise, fasting serum insulin concentration was determined with a commercial kit based on ultrasensitive ELISA methodology (DRG internacional. Inc. USA. New Jersey); insulin detection limit is <1 µU/mL. Lipoprotein(a) [Lp(a)] was measured using the latex turbidimetric method (Human Gesellschaftfür Biochemica and Diagnostica, Germany), in which the presence of Lp(a) in the sample causes agglutination of latex particles coated with antibodies against Lp(a); the cut-off value for the consideration as elevated Lp(a) levels was ≥30 mg/dL [40].
Statistical analysis
Qualitative variables were expressed as absolute and relative frequencies, assessed through the χ2 test and the Z test for Proportions. Distribution of continuous variables was evaluated by the Geary’s test. Results were expressed as medians (p25-p75), assessing differences through Mann-Whitney’s U Test or One-Way ANOVA with Bonferroni correction as required. Additionally, an ordinal logistic regression model was constructed, wherein the dependent variable included coronary risk categories for our population (low, moderate, high and very high), while the independent variables selected were: Gender, age groups, ethnic groups, occupational status, socioeconomic status, marital status, alcohol consumption (drinker and non-drinker), BMI, presence of insulin resistance (HOMA2-IR≥2), elevated Lp[a] (Lp[a] ≥30mg/dL) and fasting glycemic status. Regression coefficients (β) were calculated with their corresponding confidence intervals (CI95%), along with Odds Ratios (eβ) and their CI95%; as well as goodness of fit parameters and parallel line testing. The database analysis was done using the Statistical Package for the Social Sciences (SPSS) v. 20 for Windows (IBM Inc. Chicago, IL). Results were considered statistically significant when p<0,05.
Results
General characteristics of the population selected for coronary risk estimation
The overall sample was 2,230 individuals, but after applying the exclusion criteria a total of 1,378 subjects were used in this study, where 55.9% (n=770) were females and 44.1% (n=608) were males, with an arithmetic mean for age of 46.9±10.9 years. Sociodemographic and psychobiological characteristics according to glycemic status are presented in table 1.
Prevalence of type 2 diabetes mellitus and impaired fasting glucose
The overall (n=2,230) prevalence of DM2 in this investigation was 8.4% (n=187), of which 5.8% (n=130) had previous diagnoses of DM2 and 2.6% (n=57) were new cases (Figure 1A). A total of 435 (19.5%) individuals had IFG. However, in the subsample selected for coronary risk estimation (n=1,378), a greater prevalence of DM2 was observed (11.4%; n=157), as well as a larger proportion of subjects with IFG (23.5%; n=324); Figure 1B.
-

Figure 1:
Prevalence of Type 2 Diabetes Mellitus and Impaired Fasting Glucose. Maracaibo City Metabolic Syndrome Prevalence Study, 2014.
10-year coronary risk by glycemic status and gender
When evaluating coronary risk, a progressive increase was observed with 2.5% (1.2-5.0) for NG, 4.07% (2.09-6.62) for subjects with IFG, 4.59% (3.17-8.58) for new DM2 cases and 10.1% (6.1-14.1) for individuals with previously diagnosed DM2; p=8,64x10⁻⁴; Figure 2A. A similar pattern was observed when evaluated by gender, with a significantly higher coronary risk was observed in NG men [3.28% (1.85-5.87)] vs. NG women [2.05% (0.71-4.41); p=1,29x10⁻¹³]; and in IFG men [4.90% (3.07-7.62)] vs. IFG women [2.75% (1.34-5.65); p=1,82x10⁻⁸]); see Figure 2B. Risk was greater in diabetics, yet no gender differences were obtained.
-

Figure 2:
Ten-year coronary risk by gender and glycemic status. Maracaibo City Metabolic Syndrome Prevalence Study, 2014.
10-year coronary risk by glycemic status and sociodemographic variables
The behavior of coronary risk by glycemic status and sociodemographic variables is shown in table 2. Regarding age groups, a rise in risk was observed as age increased in all glycemic status categories, with significant differences among all age groups within NG and IFG subjects, with the exception of the 60-69 and 70-74 age groups. Previously diagnosed diabetics in the 30-39 and 40-49 age groups exhibited significant differences in coronary risk with respect to older groups (p=8.99x10⁻⁴); whilst among newly-diagnosed diabetics, significant differences were only found between the 70-74 years group with respect to all younger categories (p=2.77x10⁻⁴). Although no differences in coronary risk were found among socioeconomic strata in any glycemic status category, when assessing according to occupational status, unemployed subjects were shown to have a greater risk in all of these categories, except in newly-diagnosed diabetics (p=0.65). Finally, in regards to marital status, differences in coronary risk were only found within NG subjects, between widowed subjects and all other classifications (p=0.001).
Coronary risk, glycemic status, and psychobiological habits
When assessing coronary risk by glycemic status and smoking habits (Table 2), NG current smokers appear to have a significantly higher coronary risk when compared to past smokers and non-smokers (p=1.19x10⁻⁵ and p=5.10x10⁻⁹, respectively); whereas IFG non-smokers showed a lower risk in comparison to current and past smokers (p=8.92x10⁻⁵ and p=0.010, respectively). Although previously diagnosed diabetics did not show differences in coronary risk regarding smoking status; differences were found between current smokers and non-smokers in newly-diagnosed diabetics (p=0.007). Concerning alcoholic habits, a significantly higher coronary risk was only found in habitual drinkers vs non-drinkers in the IFG (p=0,013) and newly-diagnosed DM2 groups (p=0,027).
-
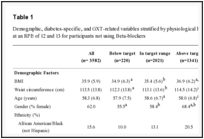
Table 2:
Ten-year coronary risk by glycemic status, sociodemograhic characteristics and psychobiological habits. Maracaibo City Metabolic Syndrome Prevalence Study, 2014.
Glycemic status and coronary risk categories
Figure 3A depicts the distribution of subjects according to coronary risk categories and glycemic status, obtaining a statistically significant association: χ2=272.422 (p=0.001). Nonetheless, when excluding diabetics and reassessing this relationship with only NG and IFG subjects, the degree of association was considerably inferior albeit still statistically significant: χ2 =27.393; p=0.001 (Figure 3B). Additionally, there was a significantly greater proportion of NG and IFG subjects in the Low and Moderate Risk categories in comparison to further stages (p<0.05). Furthermore, the proportion of previously diagnosed diabetics was significantly larger than NG and IFG in the High and Very High Risk groups; whereas the percentages of newly-diagnosed diabetics remained similar across risk categories. Finally, Table 3 exhibits the multivariate analysis between glycemic status and coronary risk categories excluding diabetic subjects, presenting the respective coefficients and odds ratios for several adjusting factors, for IFG in comparison to NG [OR: 1.46 (1.06-2.14); p=0.05].
-

Figure 3:
Glycemic status by coronary risk categories in the general population. Maracaibo City Metabolic Syndrome Prevalence Study, 2014.
-
Table 3:
Ordinal logistic regression model for coronary risk categories and glycemic status. Maracaibo City Metabolic Syndrome Prevalence Study, 2014.
Coronary risk and metabolic control in diabetics
Evaluation of coronary risk in previously diagnosed diabetics (Figure 4) revealed a significantly greater risk in poorly-controlled subjects in comparison to their well-controlled counterparts [11.28 (6.90- 15.22) vs 7.01 (4.66-12.81); p=0.044].
-

Figure 4:
10-year coronary risk by metabolic control status in subjects with previously diagnosed Type 2 Diabetes Mellitus. Maracaibo City Metabolic Syndrome Prevalence Study, 2014.
Discussion
T2DM is one of the most prevalent, incapacitating, and expensive non-communicable diseases worldwide [1,3,4]. With over 382 million people diagnosed in the United States and over 1.2 million people in Venezuela [1], it has spread in a pandemic behavior [41] Prediabetes, a premorbid state which is characterized by non-diabetic hyperglycemia [7] is also alarmingly rising, with a projection of 472 million people worldwide by the year 2030 [5]. The deadly relationship between cardiovascular disease and T2DM is widely known, especially after the “coronary heart disease equivalent” was published [42], which stated that a diabetic patient has the same cardiovascular-related death risk as a non-diabetic person who had survived a myocardial infarction.
The present study conveys the results obtained after assessing the epidemiologic behavior of coronary risk using the Framingham-Wilson Equation after recalibration for our population [26], focusing on glycemic status and how such cardiovascular risk is modified by it. The Framingham-Wilson formula can only be applied to subjects between 30-74 years of age, which was the age interval convened during its design and validation in the Framingham study [32], and in spite of this limitation, it is perhaps the most commonly applied formula for coronary risk estimation [43]. However, there has been concern relating to overestimation in Hispanic populations [23,24], and recalibration of the formula has been implemented as one of the tools to overcome this flaw [23-26].
The present results show that when assessing coronary risk by glycemic status, IFG and diabetic individuals obtained a higher risk than their NG counterparts, yet no differences in risk were found between IFG and newly-diagnosed diabetics, similar to findings published by Baena Díez et al. [44] dysglycemia and likelihood of cardiovascular risk. Exploration of IFG subjects revealed these show significantly higher hypertriacylglyceridemia, insulin levels, HOMA2-IR, BMI and waist circumference values compared to NG individuals. This behavior reflects the close link between visceral adiposity, insulin resistance and progression to DM2 [45], which only highlights that weight loss, physical activity and hypocaloric diets are key players in the management of IFG subjects, aiding in decrease of cardiovascular risk and progression to T2DM [46]. Future prospective studies are needed to evaluate which metabolic control surrogate (and corresponding cut-off point) should be used according to pharmacological treatment, evolution of prediabetes/diabetes, weight control, physical activity, nutritional variables and comorbidities observed in the patients.
Assessment of coronary risk by gender in each glycemic status group revealed that IFG men have a significantly higher risk than their female counterparts, similar to previous results from Modrego et al. [47]; however, it should be noted that coronary risk remained similar between genders among diabetics, demonstrating the role of T2DM as a gender-independent cardiovascular risk factor [48]. Although the presence of IFG has been associated with increased cardiovascular risk through its association with comorbities such as dyslipidemia and hypertension [49], several studies have proposed possible mechanisms which chronic IFG may trigger endothelial dysfunction, or at least, play a role in atherogenesis by increasing production of reactive oxygen species [50], advanced glycation end-products [51], and inducing low-grade inflammation [52]. Likewise, elements such as physical inactivity, lipid-rich and carbohydrate-rich diets have been linked with prediabetic states [53], yet few studies explore the relationship of these sociodemographic aspects with cardiovascular risk. A previous report by our research group described the influence of variables such as socioeconomic status on cardiovascular risk [25]. Although, when evaluating coronary risk in glycemic status categories -particularly in the IFG group- no differences were evidenced regarding ethnicity, socioeconomic strata or marital status; in fact, only unemployed IFG individuals presented a significantly higher risk with respect to the employed population.
Finally, a ordinal logistic model regression was constructed using variables that would help evaluate the impact of glycemic state in coronary risk; thus we didn´t include HDL-c because it is a variable already contained in the Framingham-Wilson Equation, and therefore it would generate autocorrelation of results. We also didn´t include LDL and TAG because this lipoproteins are usually altered in T2DM [54], and the risk of their elevation is actually higher when prediabetes and diabetes is diagnosed [55,56]. We decided to evaluate the role of Lp(a) because in a previous investigation from our laboratory, Lp(a) was higher in subjects with metabolic syndrome and all its components except hyperglycemia [25] sustaining a possible protective role of IFG against elevated Lp(a) levels. Such results are in accordance to those from Onat et al. [57] who published that IFG in subjects without metabolic syndrome reduced future cardiovascular risk, but in the presence of metabolic syndrome this phenomena is modified due to the presence of activated Lp(a).
Therefore, this model used the Lp(a) variable to evaluate how IFG is associated with coronary risk. The model showed that indeed IFG offered a greater probability of belonging to the higher categories of cardiovascular risk, and the fact that Lp(a) enhanced this phenomena can be associated to a more prothrombotic effect when these alterations are coexisting [57]. The association between dysglycemia and Lp(a) levels is quite interesting. In animal models [58] and clinical studies [59], it was observed that insulin inhibits apoprotein(a) synthesis and therefore seemed to act as a protector against hyperlipoproteinemia(a). However, the natural progression from prediabetes towards diabetes states a progressive loss of beta cell function and lower insulin levels [60], which could be associated to rising levels of Lp(a) in some individuals and enhanced prothrombotic effects when dysglycemia and hyperlipoproteinemia(a) are present.
There are limitations to this study, such as lack of postprandial glycemia and HbA1c which could improve and widen the results concerning prediabetes and cardiovascular risk. Follow-up studies are being developed to evaluate these 2 variables and estimate their impact on cardiovascular risk in our population.
We can conclude that 10-year coronary risk scores from the recalibrated Framingham-Wilson equation were significantly higher in subjects with IFG. In our population, this increased risk is influenced by Lp(a), sociodemographic and psychobiological traits, such as marital and occupational status, smoking and alcohol consumption. Future studies should be directed to exploration of these specific variables, and to determine the impact of intensive therapeutic management in these patients, especially in light of recent results from the Diabetes Prevention Program, which concluded that restoration of normal glucose levels in prediabetic patients reduces significantly cardiovascular risk [61].
Funding
This work was supported by research grant Nº CC-0437-10-21-09-10 from the Technological, Humanistic, and Scientific Development Council (CONDES), University of Zulia, and research grant Nº. FZ-0058-2007 from Fundacite-Zulia.
-
-
- International Diabetes Federation. International Diabetes Atlas 6th edn Brussels, Belgium: International Diabetes Federation 2013.
- Boyle JP, Thompson TJ, Gregg EW, Barker LE, Williamson DF (2010) Projection of the year 2050 burden of diabetes in the US adult population: dynamics modeling of incidence, mortality and prediabetes prevalence. Popul Health Metr 8: 29.
- National Diabetes Information Clearinghouse. National Diabetes Statistics, 2011.
- American Diabetes Association (2008) Economic costs of diabetes in the U.S. in 2007. Diabetes Care 31: 596-615.
- International Diabetes Federation. IDF Diabetes Atlas. 5. Brussels: International Diabetes Federation; 2011.
- Buysschaert M, Bergman M (2014) Definition of prediabetes. Med Clin North Am 2011; 95: 289-297.
- American Diabetes Association (2014) Diagnosis and classification of diabetes mellitus. Diabetes Care. 37: S81-90.
- Rhee SY, Woo JT (2011) The prediabetic period: review of clinical aspects. Diabeets Metab J 35: 107-116.
- Tabák AG, Herder C, Rathmann W, Brunner EJ, Kivimäki M (2012) Prediabetes: a high-risk state for diabetes development. Lancet 379: 2279-2290.
- Knowler WC, Barrett-Connor E, Fowler SE, Hamman RF, Lachin JM, et al. (2002) Diabetes Prevention Program Research Group. Reduction in the incidence of type 2 diabetes with lifestyle intervention or metformin. N Engl J Med 346: 393-403.
- Tuomilehto J, Lindstrom J, Eriksson JG, Valle TT, Hamalainen H, et al. (2001) Finnish Diabetes Prevention Study Group. Prevention of type 2 diabetes mellitus by changes in lifestyle among subjects with impaired glucose tolerance. N Engl J Med 344: 1343-1350.
- Centers for Disease Control and Prevention. National diabetes fact sheet: national estimates and general information on diabetes and prediabetes in the United States, 2011. Atlanta, GA: U.S. Department of Health and Human Services, Centers for Disease Control and Prevention, 2011.
- Murthy VL, Naya M, Foster CR, Gaber M, Hainer J, et al. (2012) Association between coronary vascular dysfunction and cardiac mortality in patients with and without diabetes mellitus. Circulation 126: 1858-1868.
- Di Carli MF, Janisse J, Grunberger G, Ager J (2003) Role of chronic hyperglycemia in the pathogenesis of coronary microvascular dysfunction in diabetes. J Am Coll Cardiol 41: 1387-1393.
- Moebus S, Stang A, Möhlenkamp S, Dragano N, Schmermund A, et al. (2009) Heinz Nixdorf Recall Study Group. Association of impaired fasting glucose and coronary artery calcification as a marker of subclinical atherosclerosis in a population-based cohort--results of the Heinz Nixdorf Recall Study. Diabetologia 52: 81-89.
- Selvin E, Lazo M, Chen Y, Shen L, Rubin J, et al. (2014) Diabetes mellitus, prediabetes, and incidence of subclinical myocardial damage. Circulation 130: 1374-1382.
- Barr EL, Boyko EJ, Zimmet PZ, Wolfe R, Tonkin AM, et al. (2009) Continuous relationships between non-diabetic hyperglycaemia and both cardiovascular disease and all-cause mortality: the Australian Diabetes, Obesity, and Lifestyle (AusDiab) study. Diabetologia 52: 415-424.
- Ford ES, Zhao G, Li C (2010) Pre-diabetes and the risk for cardiovascular disease: a systematic review of the evidence. J Am Coll Cardiol 55: 1310-1317.
- Levitan EB, Song Y, Ford ES, Liu S (2010) Is nondiabetic hyperglycemia a risk factor for cardiovascular disease? A meta-analysis of prospective studies. Arch Intern Med 164: 2147-2155.
- Coleman RL, Stevens RJ, Retnakaran R, Holman RR (2007) Framingham, SCORE, and DECODE risk equations do not provide reliable cardiovascular risk estimates in type 2 diabetes. Diabetes Care 30: 1292-1293.
- Ulmer H, Kollerits B, Kelleher C, Diem G, Concin H (2005) Predictive accuracy of the SCORE risk function for cardiovascular disease in clinical practice: a prospective evaluation of 44 649 Austrian men and women. Eur J Cardiovasc Prev Rehabil 12: 433-441.
- McEwan P, Williams JE, Griffiths JD, Bagust A, Peters JR, et al. (2004) Evaluating the performance of the Framingham risk equation in a population with diabetes. Diabet Med 21: 318-323.
- Marrugat J, D’Agostino R, Sullivan L, Elosua R, Wilson P, et al. (2003) An adaptation of the Framingham coronary heart disease risk functions to European Mediterranean areas. J Epidemiol Community Health 57: 634-638.
- Icaza G, Núñez L, Marrugat J, Mujica V, Escobar MC, et al. (2009) Estimación de riesgo de enfermedad coronaria mediante la función de Framingham adaptada para la población chilena. Rev Med Chil 137: 1273-1282.
- Bermúdez V, Rojas E, Salazar J, Bello L, Chávez M, et al. (2013) Coronary Risk Estimation According to the Framingham- Wilson Score: Epidemiologic Behavior of Innovative Cardio Metabolic Risk Factors in the Maracaibo City. Int J Cardiovasc Res 2: 4.
- Bermúdez V, Salazar J, Bello L, Rojas J, Añez R, Roque, et al. (2014) Coronary Risk Estimation According to a Recalibrated Framingham-Wilson Score in the Maracaibo City Metabolic Syndrome Prevalence Study. The Journal for Cardiology Photon 107: 160-170.
- Bermúdez V, Pacheco M, Rojas J, Córdova E, Velázquez R, Carrillo, et al. (2012) Epidemiologic behavior of obesity in the Maracaibo City metabolic syndrome prevalence study. PLoS One. 7: e35392.
- Bermúdez V, Rojas J, Salazar J, Bello L, Añez R, et al. (2013) Variations of lipoprotein(a) levels in the metabolic syndrome: a report from the Maracaibo City Metabolic Syndrome Prevalence Study. J Diabetes Res 2013: 416451.
- Bermúdez VJ, Rojas JJ, Córdova EB, Añez R, Toledo A, et al. (2013) International physical activity questionnaire overestimation is ameliorated by individual analysis of the scores. Am J Ther 20: 448-458.
- Bermúdez V, Marcano RP, Cano C, Arráiz N, Amell A, et al. (2010) The Maracaibo City Metabolic Syndrome Prevalence Study: Design and Scope. Am J Ther 17: 288-294.
- Méndez-Castellano H, De Méndez MC (1986) Estratificación social y biología humana: método de Graffar modificado. Arch Ven Pueric Pediatr 49: 93-104.
- Wilson PWF, D’Agostino RB, Levy D, Belanger AM, Silbershatz H, et al. (1998) Prediction of coronary heart disease using risk factor categories. Circulation 97: 1837-1847.
- Marrugat J, Subirana I, Comín E, Cabezas C, Vila J, et al. (2007) VERIFICA Investigators. Validity of an adaptation of the Framingham cardiovascular risk function: The VERIFICA study. J Epidemiol Community Health 61: 40-47.
- Marrugat J, Solanas P, D'Agostino R, Sullivan L, Ordovas J, et al. (2003) Coronary risk estimation in Spain using a calibrated Framingham function. Rev Esp Cardiol 56: 253-261.
- Joint National Committee on Prevention, Detection, Evaluation, and Treatment of High Blood Pressure. The seventh report of the joint national committee on prevention, detection, evaluation, and treatment of high blood pressure. JAMA 2003; 289: 2560-2571.
- World Health Organization. The World Health Report 2003.
- Berlin I, Lin S, Lima J, Bertoni A (2012) Smoking Status and Metabolic Syndrome in the Multi-Ethnic Study of Atherosclerosis. A cross-sectional study. Tob Induc Dis 10: 9.
- National Health and Medical Research Council. Australian Guidelines to Reduce Health Risks from Drinking Alcohol. 2009.
- Baglietto L, English D, Hopper J, Powles J, Giles G (2006) Average volume of alcohol consumed, type of beverage, drinking pattern and the risk of death from all causes. Alcohol Alcohol 41: 664-671.
- Leino A, Impivaara O, Kaitsaari M, Jarvisalo J (1995) Serum Concentrations of Apolipoprotein A-1, Apolipoprotein B and Lipoprotein (a) in a population sample. Clin Chem 41: 1633-1636.
- Ginter E, Simko V (2012) Type 2 diabetes mellitus, pandemic in 21st century. Adv Exp Med Biol 771: 42-50.
- Juutilainen A, Lehto S, Rönnemaa T, Pyörälä K, Laakso M (2005) Type 2 diabetes as a "coronary heart disease equivalent": an 18-year prospective population-based study in Finnish subjects. Diabetes Care 28: 2901-2907.
- D’Agostino RB Sr, Vassan RS, Pencina MJ, Wolf PA, Cobain M, et al. (2008) General Cardiovascular Risk Profile for Use in Primary Care: The Framingham Heart Study. Circulation 117; 743-753.
- Baena Díez J, Martínez Martínez J, Alvarez Pérez B, Tomàs Pelegrina J, Piñol Forcadell P, et al. (2001) Cardiovascular risk and the new diagnostic categories for diabetes mellitus proposed by the american diabetes association. Aten Primaria 28: 31-38.
- Eckel RH, Kahn SE, Ferranini E, Goldfine AB, Nathan DM, et al. (2011) Obesity and Type 2 Diabetes: What Can Be Unified and What Can Be Individualized? J Clin Endocrinol Metab 96: 1654-1663.
- Li G, Zhang P, Wang J, Gregg EW, Yang W, et al. (2008) The long-term effect of lifestyle interventions to prevent diabetes in the China Da Qing Diabetes Prevention Study: a 20-year follow-up study. Lancet 371: 1783-1789.
- Mondrego Navarro A, Rodríguez Ledo MP, Cucalón Arenal JM, Tarraga López PJ, Robledo del Corro M, et al. (2010) Impacto de la prediabetes y el sexo en el riesgo cardiovascular asociado al síndrome metabólico. Hipertensión Riesgo Vascular 27: 4-12.
- Lee WL, Cheung AM, Cape D, Zinman B (2000) Impact of diabetes on coronary artery disease in women and men: a meta-analysis of prospective studies. Diabetes Care 23: 962-968.
- Pistrosch F, Natali A, Hanefeld M (2011) Is Hyperglycemia a Cardiovascular Risk Factor? Diabetes Care 34: S128-S131.
- Fiorentino TV, Prioletta A, Zuo P, Folli F (2013) Hyperglycemia-induced oxidative stress and its role in diabetes mellitus related cardiovascular diseases. Curr Pharm Des 19: 5695-5703.
- Yan SD, Schmidt AM, Anderson GM, Zhang J, Brett J, et al. (1994) Enhanced cellular oxidant stress by the interaction of advanced glycation end products with their receptors/binding proteins. J Biol Chem 269: 9889-9897.
- Pitsavos C, Tampourlou M, Panagiotakos DB, Skoumas Y, Chrysohoou C, et al. (2007) Association Between Low-Grade Systemic Inflammation and Type 2 Diabetes Mellitus Among Men and Women from the ATTICA Study. Rev Diabet Stud 4: 98-104.
- Hill JO, Galloway JM, Goley A, Marrero DG, Minners R, et al. (2013) Scientific statement: Socioecological determinants of prediabetes and type 2 diabetes. Diabetes Care 36: 2430-2439.
- Karim MN, Ahmed KR, Bukht MS, Akter J, Chowdhury HA, et al. (2013) Pattern and predictors of dyslipidemia in patients with type 2 diabetes mellitus. Diabetes Metab Syndr 7: 95-100.
- Nam GE, Han K, Kim DH, Park YG, Yoon YJ, et al. (2014) Relationship between dyslipidemia and albuminuria in prediabetic adults: The Korea National Health and Nutrition Examination Survey 2011-2012. Endocrine DOI: 10.1007/s12020-014-0411-y.
- Meikle PJ, Wong G, Barlow CK, Weir JM, Greeve MA, et al. (2013) Plasma lipid profiling shows similar associations with prediabetes and type 2 diabetes. PLoS ONE 8: e74341.
- Onat A, Aydın M, Can G, Cakmak HA, Köroğlu B, et al. (2013) Impaired fasting glucose: Pro-diabetic, "atheroprotective" and modified by metabolic syndrome. World J Diabetes 4: 210-218.
- Rainwater D, Haffner M (1998) Insulin and 2-hour glucose levels are inversely related to Lp(a) concentrations controlled for LPA genotype. Arterioscler Thromb Vasc Biol 18: 1335-1341.
- Habib S, Aslam M, Shah S, Naveed K (2009) Lipoprotein (a) is associated with basal insulin levels in patients with type 2 diabetes mellitus. Arq Bras Cardio l93: 28-33.
- Weir G, Bonner-Weir S (2004) Five Stages of Evolving _-Cell Dysfunction During Progression to Diabetes. Diabetes 53: S16-S21.
- Perreault L, Temprosa M, Mather KJ, Horton E, Kitabchi A, et al. (2014) Diabetes Prevention Program Research Group. Regression from prediabetes to normal glucose regulation is associated with reduction in cardiovascular risk: results from the Diabetes Prevention Program outcomes study. Diabetes Care 37: 2622-2631.
-


Peertechz is an international Open Access, peer-reviewed podium which aims to provide scientists, researchers, academicians...
Submit Manuscript


Table 1:
General characteristics of the studied population by glycemic status. Maracaibo City Metabolic Syndrome Prevalence Study, 2014.
(n=897)
(n=324)
(n=109)
(48)
(n=1,378)
Gender
Female
Male
Age Groups (years)
30-39
40-49
50-59
60-69
70-74
Ethnic Groups
Mixed Race
Hispanic White
Afro-Venezuelan
Indigenous American
Others
Marital Status
Single
Married
Widowed
Divorced
Occupational Status
Employed
Unemployed
Socioeconomic Status
Classes I and II
Class III
Classes IV and V
Alcohol Consumption ¥
Drinkers
Non-Drinkers
Smoking Habits
Current Smokers
Non-Smokers
Past Smokers
NG: Normoglycemics. IFG: Impaired Fasting Glucose. DM2: Type 2 Diabetes Mellitus.
*Previously diagnosed Type 2 Diabetes Mellitus. § Newly-diagnosed Type 2 Diabetes Mellitus.
¥ Drinker defined as ≥1 gram of alcohol per day.
Table 1: General characteristics of the studied population by glycemic status. Maracaibo City Metabolic Syndrome Prevalence Study, 2014.